Figures & data
Table 1 Comparisons between the two groups in sex, age, respiratory rate, and arterial blood gas analysis indexes before treatment
Figure 1 Study flow and randomization of patients to the intervention and control groups.
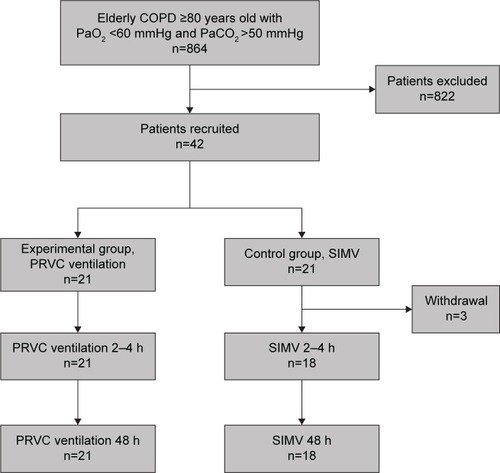
Table 2 The vital signs, blood gas analysis, and indexes of breathing mechanics 2–4 hours and 48 hours after treatment in the two groups
Figure 2 Changes in pH over time (2–4 h and 48 h) in the intervention and control groups.
Notes: The black bar represents the intervention group, and the gray bar represents the control group. *P<0.05.
Abbreviations: pH, hydrogen ion concentration; h, hours; PRVC, pressure-regulated volume control; SIMV, synchronized intermittent mandatory ventilation.
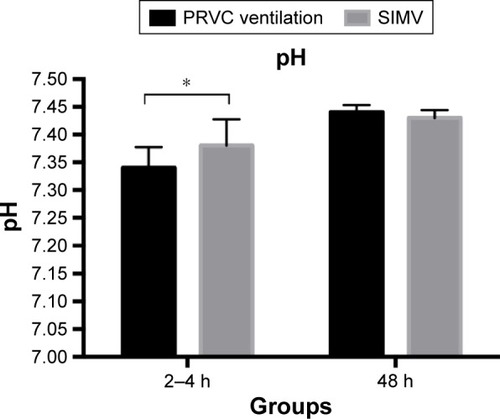
Figure 3 Changes in PaCO2 (mmHg) over time (2–4 h and 48 h) in the intervention and control groups.
Notes: The black bar represents the intervention group, and the gray bar represents the control group. *P<0.05.
Abbreviations: PaCO2, partial pressure of carbon dioxide in arterial blood; h, hours; PRVC, pressure-regulated volume control; SIMV, synchronized intermittent mandatory ventilation.
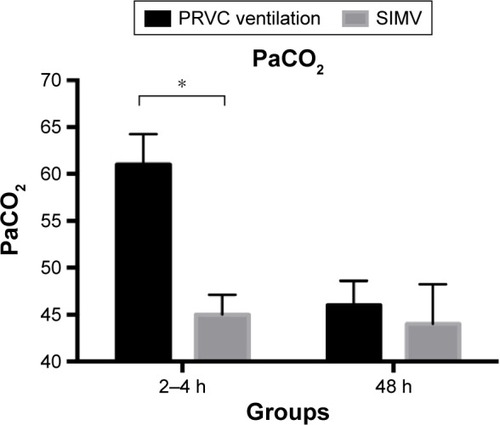
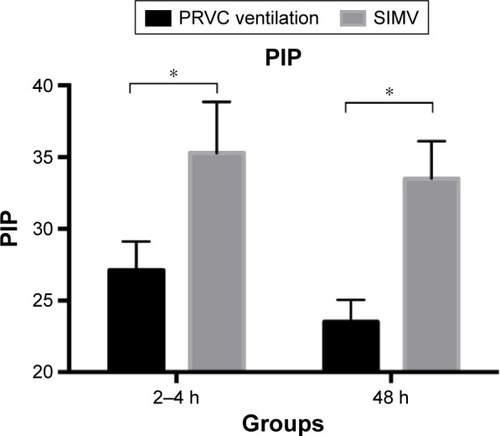
Figure 4 Changes in PIP (cmH2O) over time (2–4 h and 48 h) in the intervention and control arms.
Abbreviations: PIP, peak inspiratory pressure; h, hours; PRVC, pressure-regulated volume control; SIMV, synchronized intermittent mandatory ventilation.