Figures & data
Table 1 Descriptive characteristics of the study population
Figure 1 Cytokine expression in serum.
Notes: Serum levels of (A) IL-10, (B) CCL5, and (C) TNF-α were measured in healthy control (n=15), GOLD Group B: low risk, more symptoms; GOLD Group C: high risk, less symptoms; GOLD Group D: high risk, more symptoms.
Abbreviations: IL-10, interleukin-10; TNF-α, tumor necrosis factor-α; GOLD, Global initiative for chronic Obstructive Lung Disease; ANOVA, analysis of variance; CI, confidence interval.
Abbreviations: IL-10, interleukin-10; TNF-α, tumor necrosis factor-α; GOLD, Global initiative for chronic Obstructive Lung Disease; ANOVA, analysis of variance; CI, confidence interval.
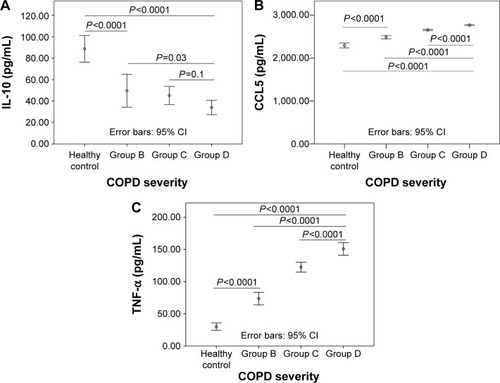
Figure 2 Cytokine expression in COPD/healthy PBMCs.
Notes: Pooled PBMCs from healthy control, GOLD B, GOLD C, and GOLD D patients were stimulated with control, LPS only, and LPS with pretreatment of serially diluted SB203508 (5, 10, or 15 μM final concentration); for each condition, levels of (A) IL-10, (B) CCL5, and (C) TNF-α from the cell culture media were measured. Group differences were analyzed by one-way ANOVA and adjusted by Bonferroni correction. *Healthy vs GOLD D, P<0.05; #GOLD C vs GOLD D, P<0.0; Δhealthy vs GOLD B, P<0.05. GOLD Group B: low risk, more symptoms; GOLD Group C: high risk, less symptoms; GOLD Group D: high risk, more symptoms.
Abbreviations: PBMCs, peripheral blood mononuclear cells; GOLD, Global initiative for chronic Obstructive Lung Disease; LPS, lipopolysaccharide; IL-10, interleukin-10; TNF-α, tumor necrosis factor-α, ANOVA, analysis of variance.
Abbreviations: PBMCs, peripheral blood mononuclear cells; GOLD, Global initiative for chronic Obstructive Lung Disease; LPS, lipopolysaccharide; IL-10, interleukin-10; TNF-α, tumor necrosis factor-α, ANOVA, analysis of variance.
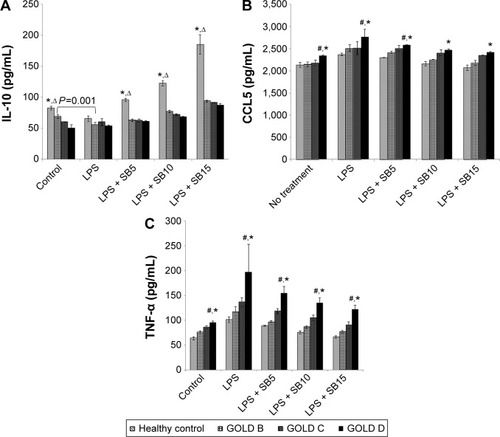
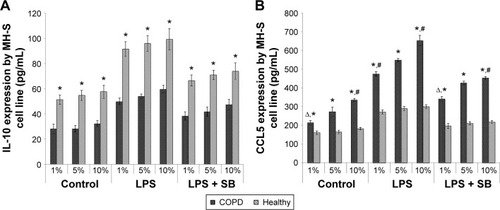
Figure 3 Cytokine expression in MH-S cell line supplemented with COPD/healthy serum.
Notes: MH-S cell lines were cultured in media supplemented with 1%, 5%, or 10% serum pooled from healthy control or COPD patients (GOLD C/D). For each condition, cells were stimulated with control, LPS only, or LPS pretreated with SB203580. Levels of (A) IL-10 and (B) CCL5 in the cell culture media were measured. Group differences were analyzed by one-way ANOVA and adjusted by Bonferroni correction. *Healthy vs COPD, P<0.05; #10% serum vs 5% serum of the same stimulation group, P<0.05; Δ1% serum vs 5% serum of the same stimulation group, P<0.05.
Abbreviations: LPS, lipopolysaccharide; GOLD, Global initiative for chronic Obstructive Lung Disease; IL-10, interleukin-10; ANOVA, analysis of variance.
Abbreviations: LPS, lipopolysaccharide; GOLD, Global initiative for chronic Obstructive Lung Disease; IL-10, interleukin-10; ANOVA, analysis of variance.