
Figures & data
Figure 1 Study flow diagram.
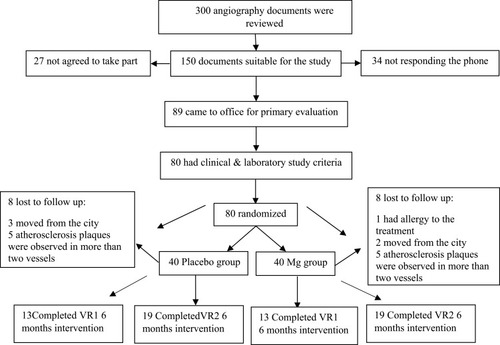
Table 1 Study Variables in MgSO4 Treated Moderate Coronary Artery Disease Patients with One (Mg-Treated-VR1) and Two (Mg-Treated-VR2) Atherosclerotic Vessels as Well as in Placebo Treated Patients with One (Control-VR1) and Two (Control-VR2) Atherosclerotic Vessels Before Intervention. Data Were Presented as Mean ±SD and Analyzed Using Repeated Measure and ANCOVA
Table 3 Study Variables in MgSO4 Treated Moderate Coronary Artery Disease Patients with One (Mg-Treated-VR1) and Two (Mg-Treated-VR2) Atherosclerotic Vessel as Well as in Placebo Treated Patients with One (Control-VR1) and Two (Control-VR2) Atherosclerotic Vessels Before Intervention, three and six Months After Intervention. Data Were Presented as Mean ± SD and Analyzed Using Repeated Measure and ANCOVA
Table 4 Study Variables in Moderate Coronary Artery Disease Patients with One Atherosclerotic Vessel (VR1, N=32) and Moderate Coronary Artery Disease Patients with Two Atherosclerotic Vessels (VR2, N=32) Before Intervention (Data are Expressed as Mean ±SD and Comparisons Between Groups were Analyzed Using the Student’s t-test)
Figure 2 Plasma Ca (A), Mg (B), Na (C), K (D), Cr (E), BUN (F) levels and urine Mg level (G) in MgSO4-treated moderate coronary artery disease patients with one atherosclerotic vessel (Mg-treated-VR1), MgSO4-treated moderate coronary artery disease patients with two atherosclerotic vessels (Mg-treated-VR2), placebo-treated moderate coronary artery disease patients with one atherosclerotic vessel (Control-VR1) and placebo-treated moderate coronary artery disease patients with two atherosclerotic vessels (Control-VR2). N=13 for one atherosclerotic vessel in each group and N=19 for two atherosclerotic vessels in each group. Data were presented as mean ±SD and data were analyzed using repeated measure and ANCOVA. *P<0.001 significant differences between three months Mg-treated-VR1 and before intervention (baseline) and six months after intervention. #P<0.001 significant differences between three months control-VR1 and before intervention (baseline) and six months after intervention. $P<0.01 significant differences between Mg-treated-VR2 and VR1 with control-VR2 and VR1 six months after intervention.
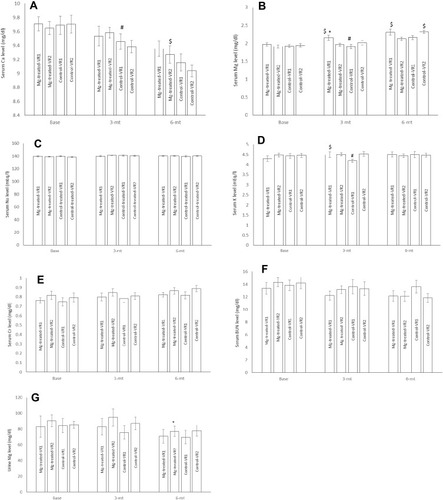
Figure 3 ESR (A), Ca/Mg ratio (B) and serum CRP (C), uric acid (D), fibrinogen (E) and homocysteine (F) levels in MgSO4-treated moderate coronary artery disease patients with one atherosclerotic vessel (Mg-treated-VR1), MgSO4-treated moderate coronary artery disease patients with two atherosclerotic vessels (Mg-treated-VR2), placebo treated moderate coronary artery disease patients with one atherosclerotic vessel (Control-VR1) and placebo treated moderate coronary artery disease patients with two atherosclerotic vessels (Control-VR2). N=13 for one atherosclerotic vessel in each group and N=19 for two atherosclerotic vessels in each group. Data were presented as mean ±SD and data were analyzed by using repeated measure and ANCOVA. *P<0.01 significant differences between VR1 and VR2 in each groups. #P<0.01 significant differences between three month Mg-treated-VR2 and before intervention (baseline) and/or six months after intervention. $P<0.01 significant differences between three months control-VR2 and before intervention (baseline) and six months after intervention and three months Mg-treated-VR2 group. @P<0.01 significant differences between Mg-treated-VR2 and VR1 with control-VR2 and VR1 six months after intervention.
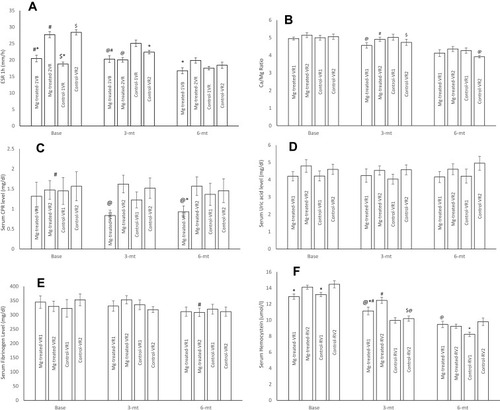
Figure 4 Serum TSH (A), T3 (B), and T4 (C), levels in MgSO4-treated moderate coronary artery disease patients with one atherosclerotic vessel (Mg-treated-VR1), MgSO4-treated moderate coronary artery disease patients with two atherosclerotic vessels (Mg-treated-VR2), placebo treated moderate coronary artery disease patients with one atherosclerotic vessel (Control-VR1) and placebo treated moderate coronary artery disease patients with two atherosclerotic vessels (Control-VR2). N=13 for one atherosclerotic vessel in each group and N=19 for two atherosclerotic vessels in each group. Data were presented as mean ±SD and data were analyzed by using repeated measure and ANCOVA. *P<0.001 significant differences between VR1 and VR2 in each groups. **P<0.01 significant differences between three months Mg-treated-VR2 and before intervention (baseline) and six months after intervention. ***P<0.01 significant differences between Mg-treated-VR2 and VR1 with control-VR2 and VR1 six months after intervention.****P<0.01 significant differences between three months control-VR2 and before intervention (baseline) and six months after intervention and 3 months Mg-treated-VR2 group.
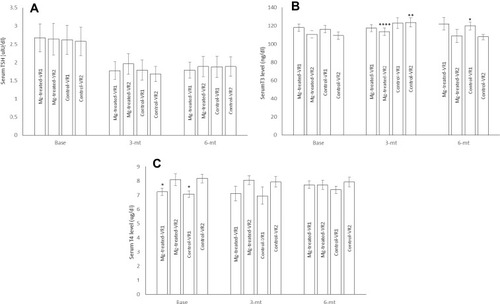
Table 2 Study Variables in MgSO4 Treated Moderate Coronary Artery Disease Patients with One (Mg-Treated-VR1) and Two (Mg-Treated-VR2) Atherosclerotic Vessel as Well as in Placebo Treated Patients with One (Control-VR1) and Two (Control-VR2) Atherosclerotic Vessels Before Intervention. Data Were Presented as Mean ±SD and Analyzed Using Repeated Measure and ANCOVA