Figures & data
Figure 1 Schematic representation of the Franz cell.
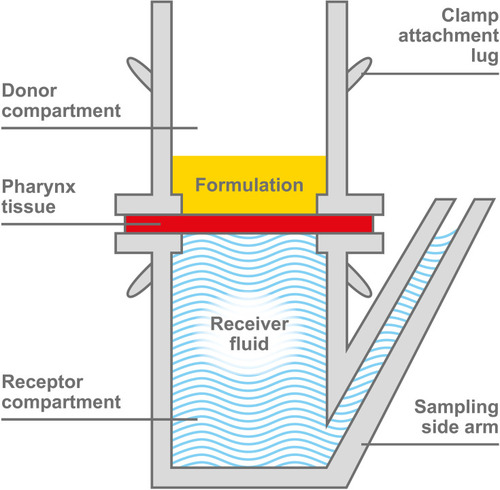
Figure 2 Sectioning of the human pharynx tissue vertically (A) and sectioning of the human pharynx tissue horizontally (B).
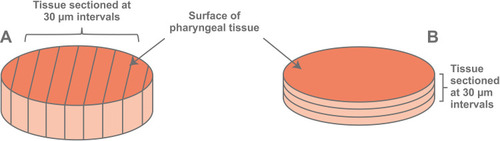
Figure 3 Distribution of flurbiprofen within pharynx tissue (percentage of total flurbiprofen detected within pharynx tissue). Each tissue sample has been split into thirds. Height of tissue pieces is scaled according to the actual depth of tissue. Red to yellow: highest to lowest level of flurbiprofen; white: no flurbiprofen detected.
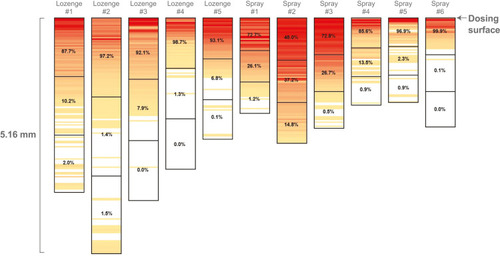
Figure 4 Mean percentage of applied dose of radiolabeled flurbiprofen recovered from the pharynx tissue. Error bars represent standard deviation.
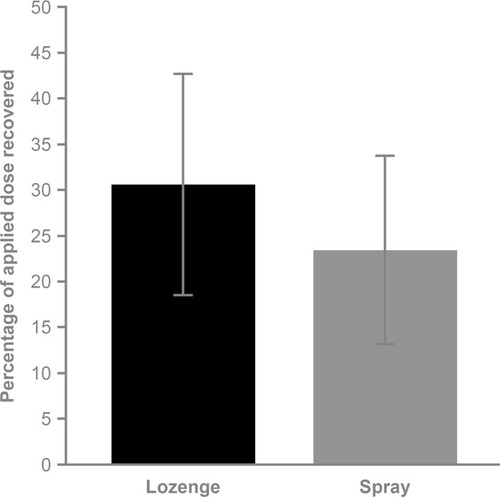
Table 1 Tissue Thickness and Percentage of Applied Dose of Flurbiprofen Recovered within Pharynx Tissue
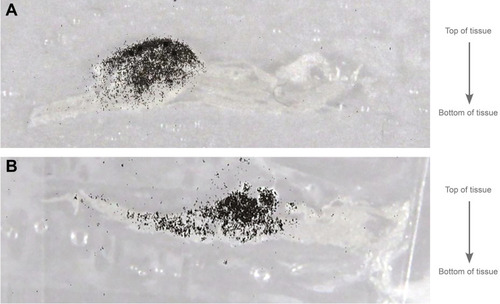
Figure 5 Representative images of the radiolabeled flurbiprofen within a vertical section of pharynx tissue, dosed with radiolabeled flurbiprofen lozenge (A) or spray (B) solution, overlaid with an image of the corresponding tissue.