Figures & data
Table 1 The MIC and the FIC of Metformin Alone and in Combination Against the Tested Bacterial Strains
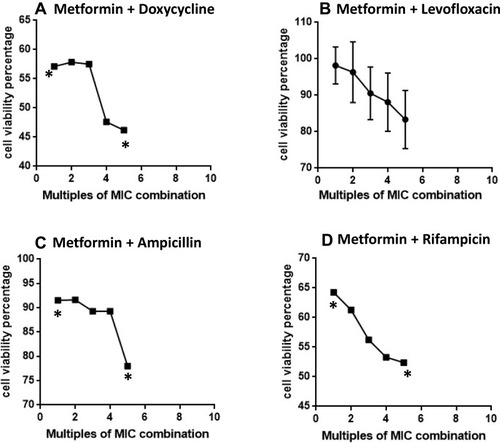
Figure 1 The cytotoxicity of combinations of metformin and tested antibiotics in VERO cell line expressed as cell viability percentage, A. Metformin + Doxycycline, B. Metformin + Levofloxacin, C. Metformin + Ampicillin, and D. Metformin + Rifampicin. Dose of combination is expressed as multiples of MIC of the combination of metformin and the tested antibiotic. Points between the two stars (*) are significantly different from baseline (zero dose) cell viability using unpaired t-test and P<0.05. Values are expressed as Mean±SD.