
Figures & data
Figure 1 Study design.
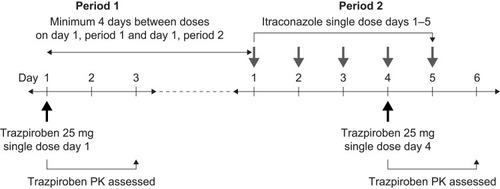
Figure 2 Mean plasma concentration–time curves of trazpiroben after administration of a single oral dose of trazpiroben 25 mg in the presence and absence of itraconazole on (A) a linear scale and (B) a semi-log scale.
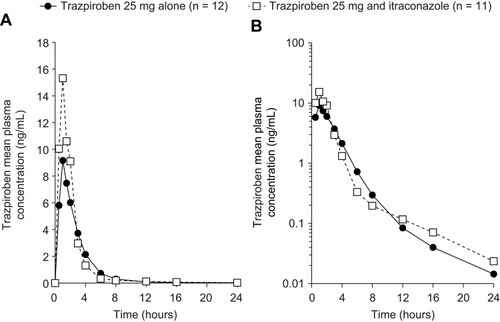
Figure 3 (A) Cmax and (B) AUC0–∞ of trazpiroben after administration of a single oral dose of trazpiroben 25 mg in the presence and absence of itraconazole.
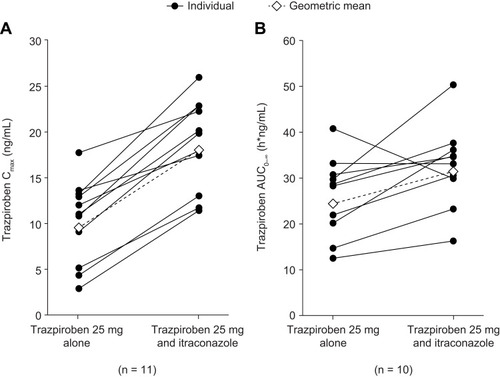
Table 1 Summary of the Plasma Pharmacokinetic Parameters of Trazpiroben 25 mg in the Presence and Absence of Itraconazole
Table 2 Summary of the Plasma Pharmacokinetic Parameters of Trazpiroben and M23 After Administration of a Single Oral Dose of Trazpiroben 25 mg in the Presence and Absence of Itraconazole
Figure 4 Mean plasma concentration–time curves of M23 (a pharmacologically inactive metabolite of trazpiroben) after administration of a single oral dose of trazpiroben 25 mg in the presence and absence of itraconazole on (A) a linear scale and (B) a semi-log scale.
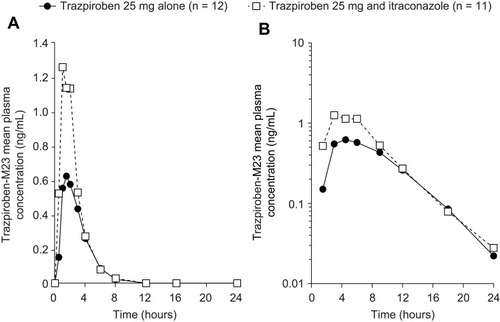
Figure 5 Linear mixed-effects model of the predicted ΔΔQTcF at different trazpiroben plasma concentrations after administration of a single oral dose of trazpiroben 25 mg in the presence and absence of itraconazole.
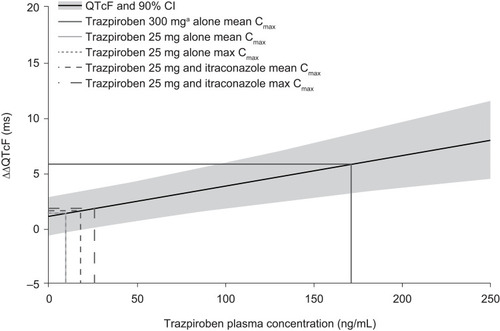
Table 3 Summary of Mean 12-Lead Triplicate ECG QT Intervals Corrected Using Fridericia’s FormulaCitation22