Figures & data
Figure 1 Map of the study area.
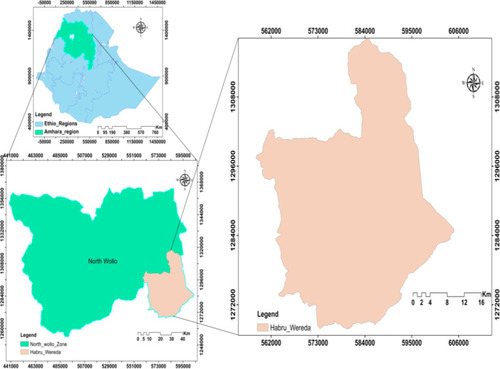
Figure 2 Maximum wavelength (λmax) of caffeine in distilled water with the UV-Vis spectroscopic method.
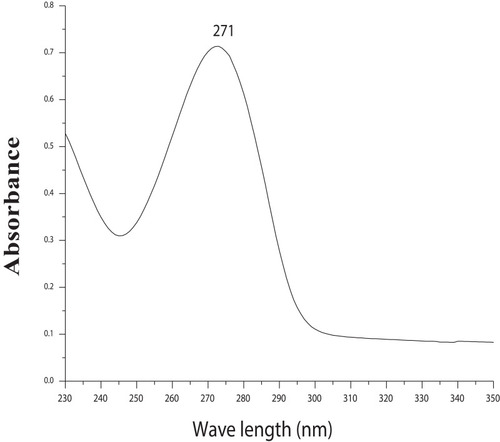
Figure 3 Maximum wavelength (λmax) of caffeine in dichloromethane with the UV-Vis spectroscopic method.
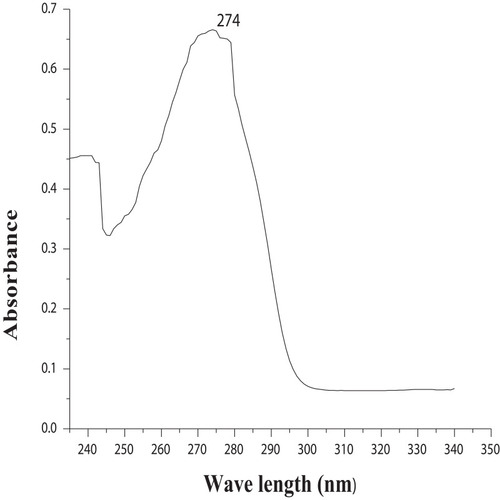
Figure 4 Calibration curve of standard caffeine solution in distilled water.
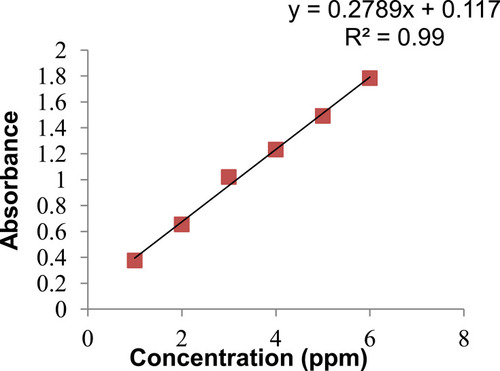
Table 1 Caffeine Content in the Coffee Samples with Aqueous Phase Extraction
Figure 5 Calibration curve of standard caffeine solution in dichloromethane.
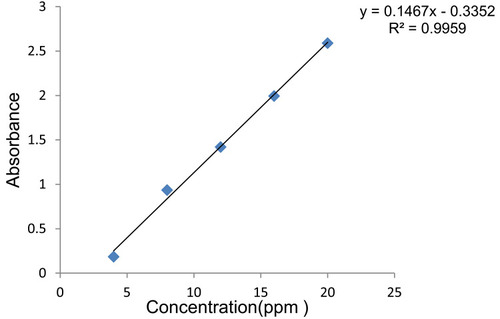
Table 2 Caffeine Content in the Coffee Samples with Dichloromethane Extraction
Figure 6 Comparison of the caffeine value in roasted coffee beans in the three sampling types.
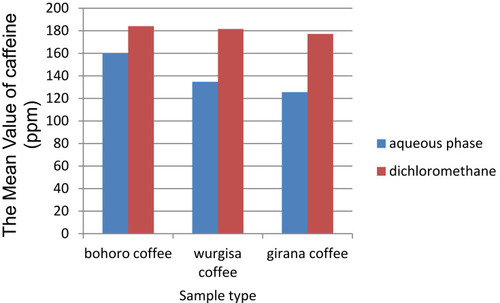
Figure 7 Comparison of the amount of caffeine in raw coffee beans in the three sampling types.
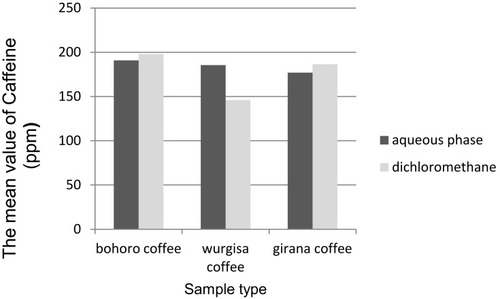
Table 3 Mean Percentage of Hydrogen Peroxide Scavenging Activity of an Aqueous Phase Extraction of Coffee Bean Samples, by Sampling Site, and Ascorbic Acid
Table 4 Calibration Equations, Pearson Correlations, and IC50 Values of an Aqueous Phase Extraction of the Coffee Samples, by Sampling Site
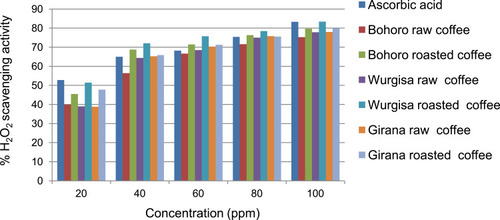
Figure 8 Comparison of the hydrogen peroxide scavenging activity of the coffee sample and ascorbic acid.