
Figures & data
Figure 1 Trial flow and study selection.
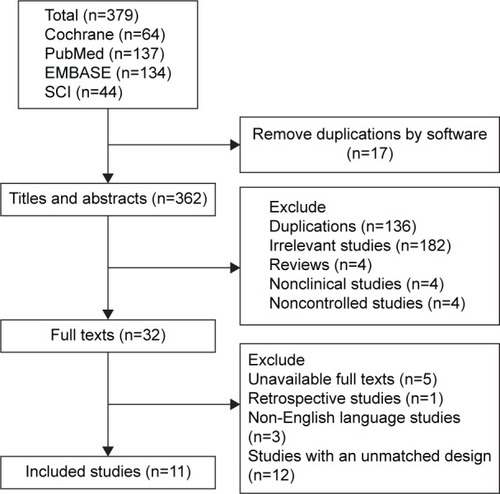
Table 1 Characteristics of the included studies
Figure 2 Risk of bias graph: the overall risk of each bias is presented as a percentage representing the risk in all the included studies.
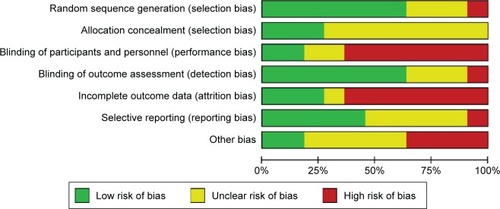
Figure 3 Risk of bias summary: the risk of each bias in each of the included studies is shown separately.
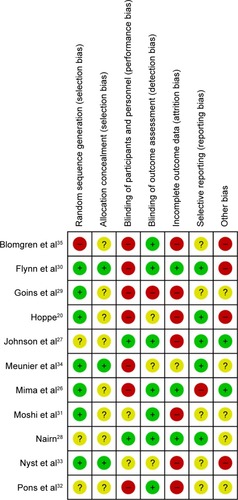
Table 2 Clinical and mycological efficacy of nystatin and the control treatments
Table 3 Meta-analysis of the efficacy of nystatin compared with that of the placebo and fluconazole
Figure 4 Forest plots evaluating the efficacy of nystatin (fixed-effect model).
Abbreviations: CI, confidence interval; OR, odds ratio.
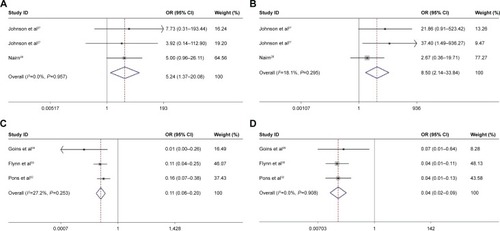
Table 4 Summary of the usage and efficacy of nystatin
Table 5 Adverse effects of nystatin and the control treatments
Table S1 Risk of bias and quality assessment of the included studies