Figures & data
Table 1 Design matrix including investigated process variables with their levels
Figure 1 Scanning electron photomicrographs of the optimized CTZ microspheres at (A) ×200 magnification, (B) ×300 magnification, (C) ×450 magnification, and (D) ×750 magnification.
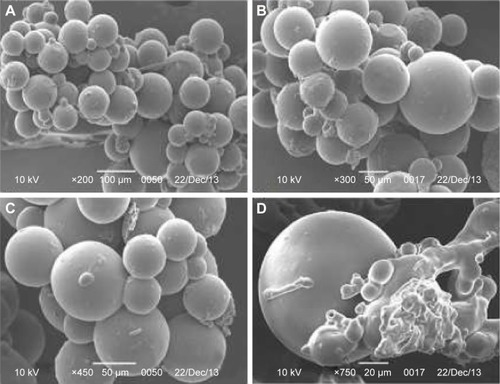
Table 2 Observed values of responses (Y1–Y7) for 18 formulations of CTZ-loaded polymethacrylate microspheres
Figure 2 Release profiles of CTZ from the D-LSCD formulations; (A) release profiles for F1–F6, (B) release profiles for F7–F12, and (C) release profiles for F13–F18.
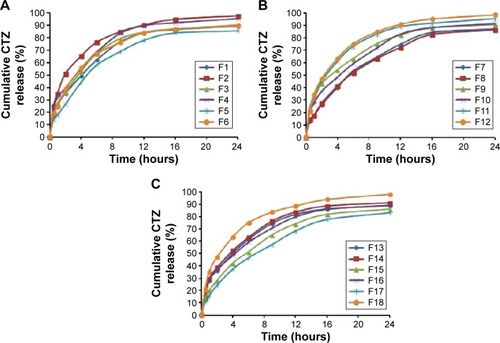
Figure 3 Pareto charts of standardized effects on the particle size (A), angle of repose (B), production yield (C), encapsulation efficiency (D), loading capacity (E), initial release (F), and time for 85% of drug release (G).
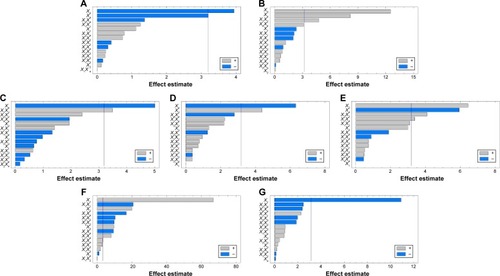
Figure 4 Three-dimensional response surfaces with contour plots below generated from the D-LSCD demonstrating the effect of ERL loading%, emulsifier HLB, talc percentage, and the dispersed phase volume on the particle size (A), angle of repose (B), production yield (C), encapsulation efficiency (D), loading capacity (E), initial release (F), and time for 85% of drug release (G).
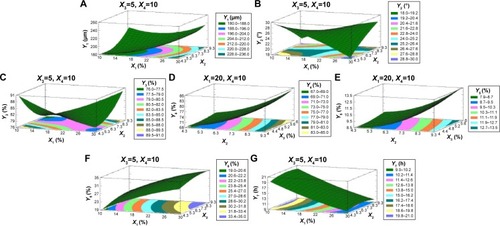
Figure 5 Correlations of the factors and responses.
Abbreviations: HLB, hydrophilic lipophilic balance; ERL, Eudragit RLPO; EE, encapsulation efficiency; LC, loading capacity; T85%, time for 85% of drug release.
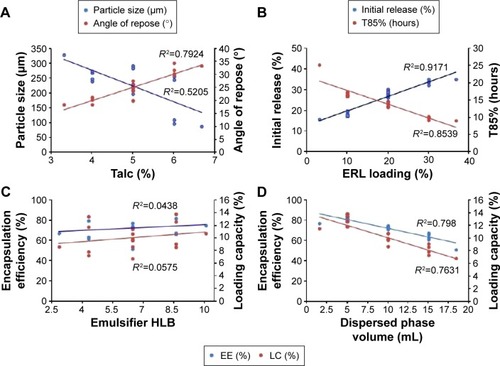
Table 3 Statistical ANOVA of the responses (Y1–Y7)
Table 4 Optimum combination of factors, predicted values, observed values, the residuals, and the prediction error percentage for the optimized formulations of CTZ-loaded polymethacrylate microspheres
Table 5 Pharmacokinetic parameters of CTZ following the administration of a single oral dose (10 mg) of the marketed tablets, and the optimized formulation of CTZ microspheres equivalent to 10 mg
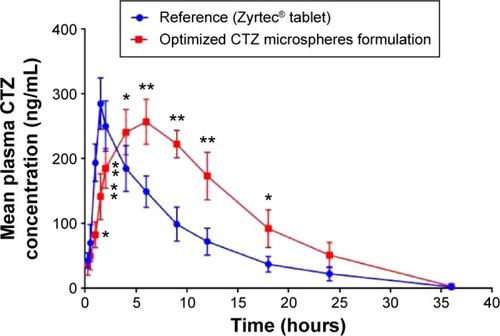
Figure 6 Mean plasma concentration–time profiles for CTZ after the oral administration of a single dose (10 mg) of the marketed tablet and the optimized CTZ-loaded polymethacrylate microspheres.
Abbreviation: CTZ, cetirizine hydrochloride.