Figures & data
Table 1 Comparison values of IC50 of FLS, FLA, and FLB in MCF-7, MDA-MB-231 and MCF-10A cells
Table 2 The accession number and sequence of the primers used in the quantitative real-time PCR assay
Figure 1 The molecular structures of FLS, flavokawain A and flavokawain B.
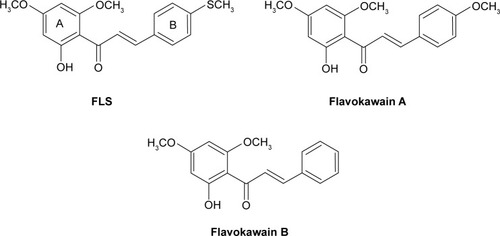
Figure 2 Light microscopic images of MCF-7.
Abbreviations: FLS: (E)-1-(2′-Hydroxy-4′,6′-dimethoxyphenyl)-3-(4-methylthio)phenyl)prop-2-ene-1-one; SE, standard error of the mean.
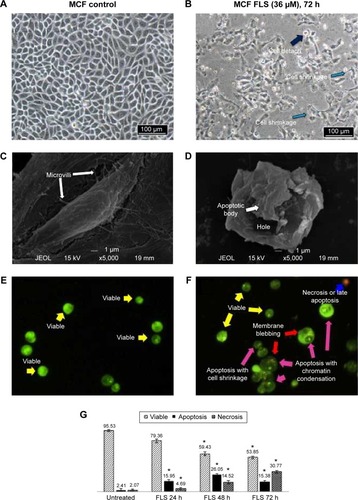
Figure 3 Flow cytometry cell cycle and Annexin V analyses of control and FLS treated MCF-7 cells.
Abbreviations: FLS: (E)-1-(2′-Hydroxy-4′,6′-dimethoxyphenyl)-3-(4-methylthio)phenyl)prop-2-ene-1-one; SE, standard error of the mean; FITC+/PI+, late apoptosis population; FITC−/PI−, healthy cell population; FITC+/PI−, early apoptosis population; S, synthesis; RFU, relative fluorescence unit.
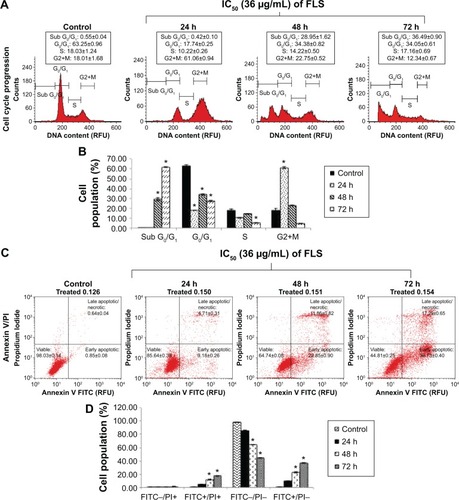
Figure 4 qPCR analysis of apoptosis and cell cycle related genes; PLK1, WEE-1, c-Jun, GLUT in MCF-7 treated with FLS (36 μM) for 24, 48, and 72 hours.
Abbreviations: FLS: (E)-1-(2′-Hydroxy-4′,6′-dimethoxyphenyl)-3-(4-methylthio)phenyl)prop-2-ene-1-one; SE, standard error of the mean; qPCR, quantitative real time polymerase chain reaction.
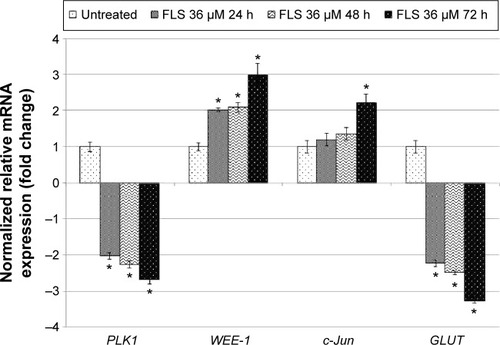
Figure 5 Differential protein expression of untreated and FLS treated MCF-7 cells.
Abbreviations: FLS: (E)-1-(2′-Hydroxy-4′,6′-dimethoxyphenyl)-3-(4-methylthio)phenyl)prop-2-ene-1-one; SE, standard error of the mean.
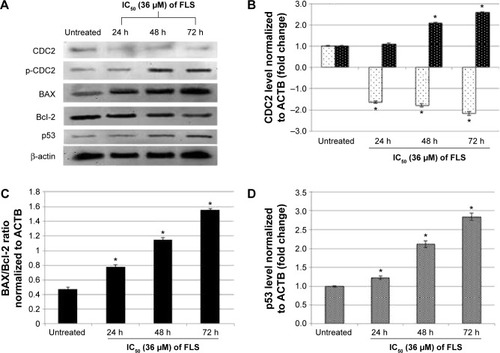
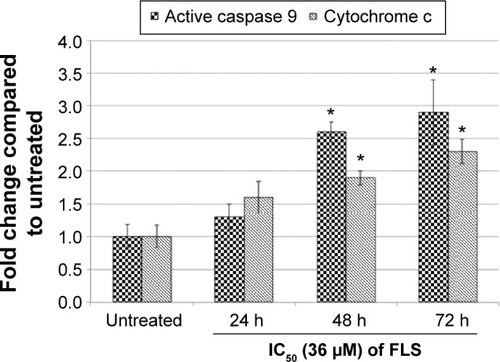
Figure 6 Detection of the activation of caspase 9 and cytochrome c in MCF-7 treated with FLS (36 μM) for 24, 48, and 72 hours.
Abbreviations: FLS: (E)-1-(2′-Hydroxy-4′,6′-dimethoxyphenyl)-3-(4-methylthio) phenyl)prop-2-ene-1-one; SE, standard error of the mean.