Figures & data
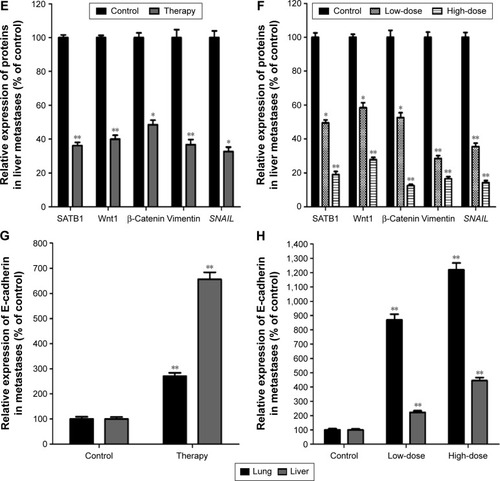
Figure 1 Chemical structure of baicalein.
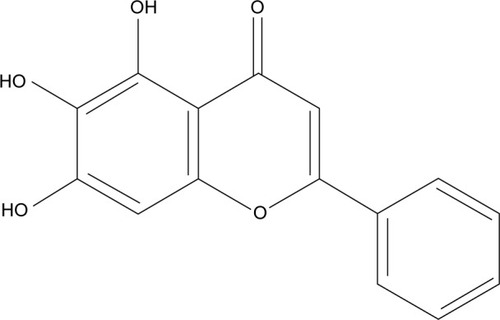
Table 1 Experimental grouping and treatment
Table 2 Primers used for qRT-PCR analysis
Table 3 Effect of baicalein on proliferation of MDA-MB-231 cells (, n=6)
Figure 2 Baicalein inhibits the proliferation of MDA-MB-231 cells.
Abbreviations: SD, standard deviation; MTT, 3-(4,5-dimethylthiazol-2-yl)-5-(3-carboxyme-thoxyphenyl)-2-(4-ulfophenyl)-2H-tetrazolium.
Figure 3 Baicalein inhibits the motility of MDA-MB-231 cells.
Abbreviations: FBS, fetal bovine serum; SD, standard deviation; h, hours.
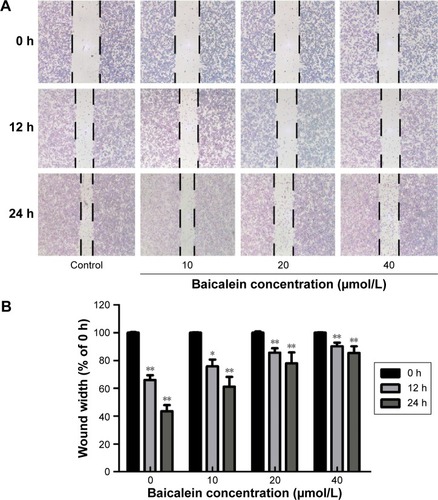
Figure 4 Baicalein inhibits the invasiveness of MDA-MB-231 cells.
Abbreviations: FBS, fetal bovine serum; SD, standard deviation.
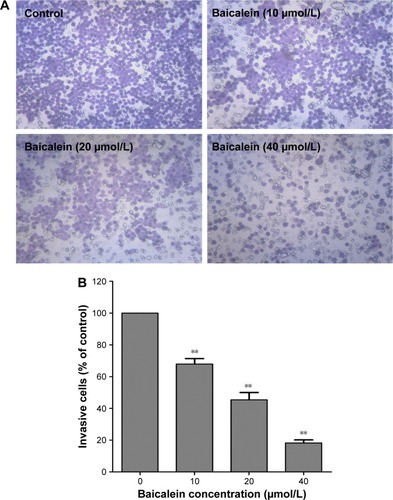
Figure 5 Baicalein suppresses liver metastasis of breast cancer in vivo.
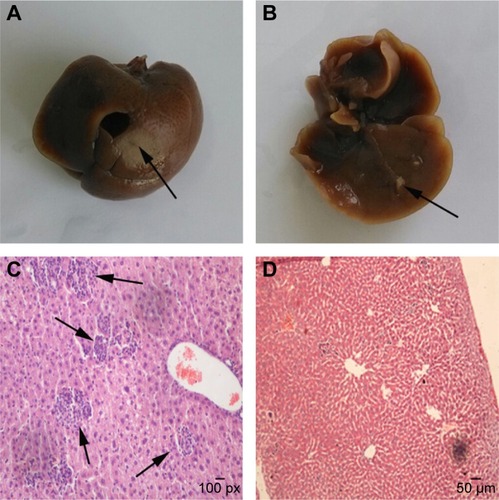
Figure 6 Baicalein suppresses lung metastasis of breast cancer in vivo.
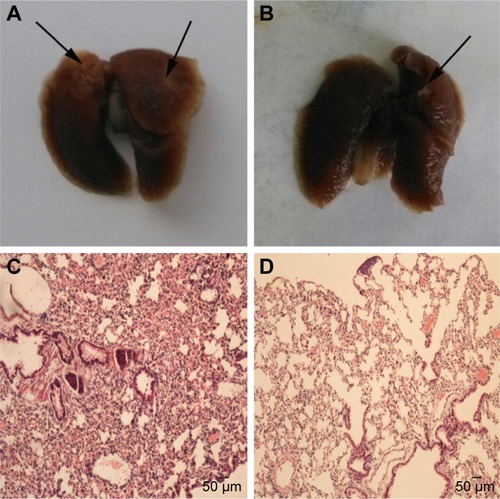
Figure 7 SATB1 expression correlates with the invasiveness of breast cancer cell lines.
Abbreviation: SD, standard deviation.
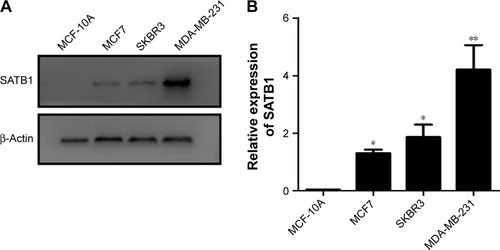
Figure 8 Baicalein suppresses the expression of SATB1 in MDA-MB-231 cells.
Abbreviations: mRNA, messenger RNA; qRT-PCR, quantitative reverse transcription polymerase chain reaction; SD, standard deviation.
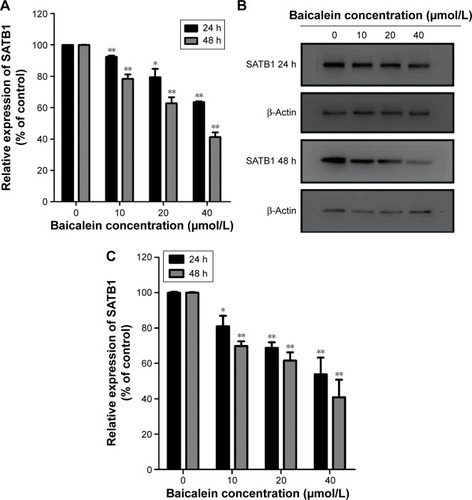
Figure 9 Baicalein suppresses the expression of vimentin in MDA-MB-231 cells.
Abbreviations: mRNA, messenger RNA; qRT-PCR, quantitative reverse transcription polymerase chain reaction; SD, standard deviation.
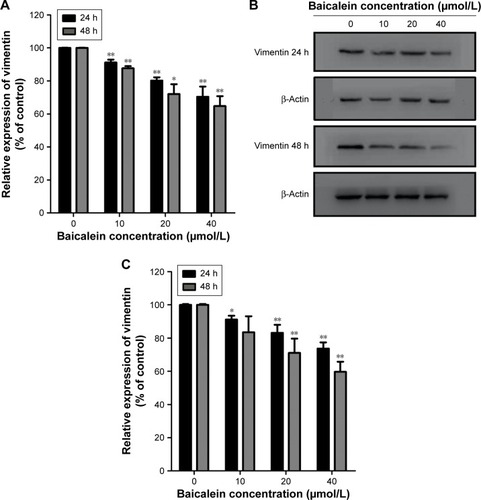
Figure 10 Baicalein suppresses the expression of SNAIL in MDA-MB-231 cells.
Abbreviations: mRNA, messenger RNA; qRT-PCR, quantitative reverse transcription polymerase chain reaction; SD, standard deviation.
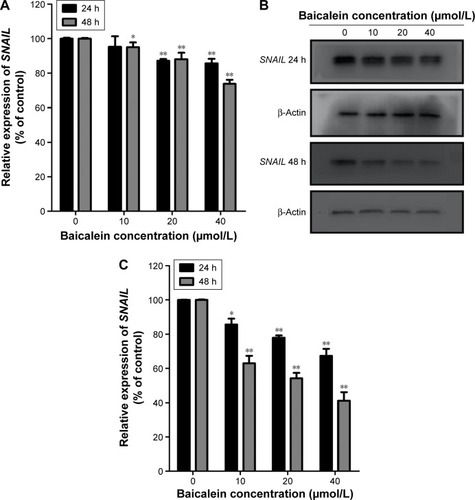
Figure 11 Baicalein increases the expression of E-cadherin in MDA-MB-231 cells.
Abbreviations: mRNA, messenger RNA; qRT-PCR, quantitative reverse transcription polymerase chain reaction; SD, standard deviation.
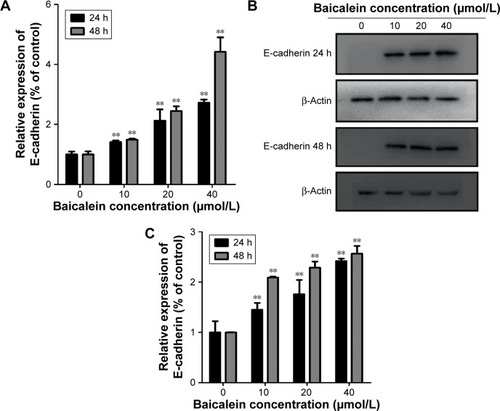
Figure 12 Baicalein inhibits the expression of Wnt1 in MDA-MB-231 cells.
Abbreviation: SD, standard deviation.
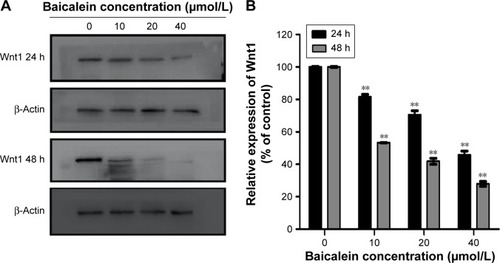
Figure 13 Baicalein inhibits the expression of β-catenin in MDA-MB-231 cells.
Abbreviations: mRNA, messenger RNA; qRT-PCR, quantitative reverse transcription polymerase chain reaction; SD, standard deviation.
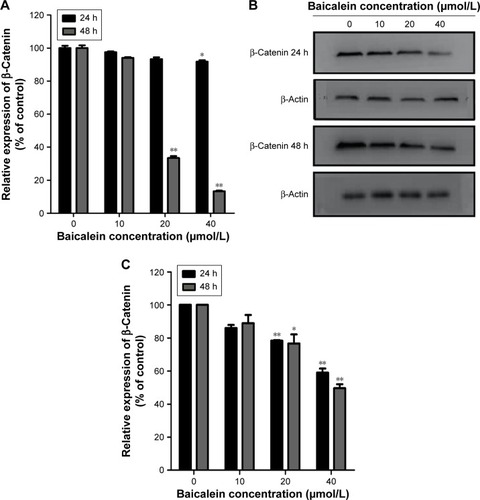
Figure 14 Baicalein suppresses the expression of Axin2 and Cyclin D1 in MDA-MB-231 cells.
Abbreviations: mRNA, messenger RNA; qRT-PCR, quantitative reverse transcription polymerase chain reaction; SD, standard deviation.
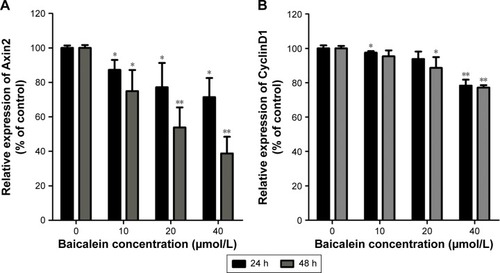
Figure 15 Representative SATB1, Wnt1, β-catenin, E-cadherin, vimentin, and SNAIL expression in lung metastases of nude mouse model by immunohistochemistry.
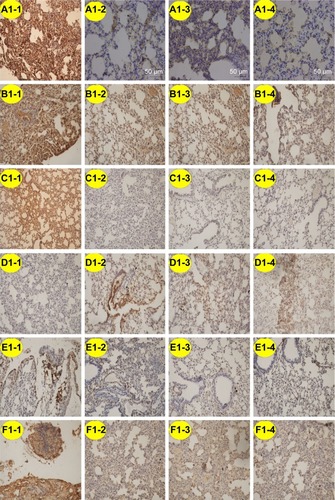
Figure 16 Representative SATB1, Wnt1, β-catenin, E-cadherin, vimentin, and SNAIL expression in liver metastases of nude mouse model assessed by immunohistochemistry.
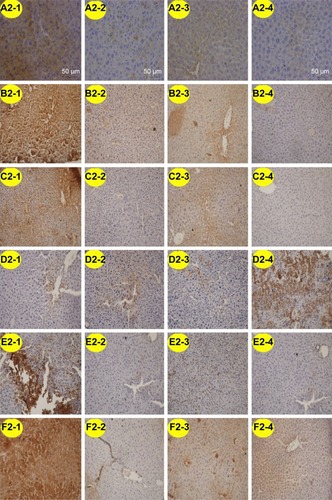
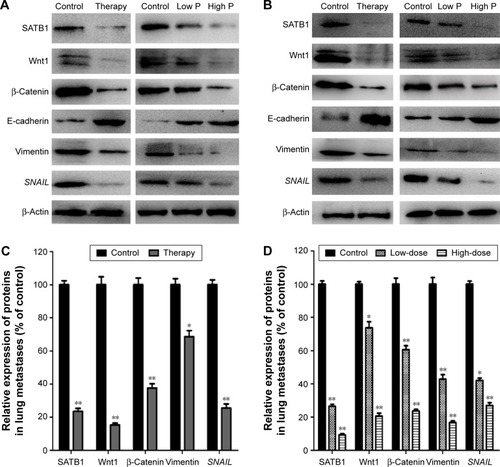
Figure 17 Expression of SATB1, Wnt1, β-catenin, E-cadherin, vimentin, and SNAIL in metastases of nude mouse model assessed by Western blot.