
Figures & data
Table 1 Demographic and baseline clinical characteristics
Table 2 Summary of efficacy results for the only patient who tested positive for both IgG and neutralizing antibodies
Figure 1 Heart rate variability as assessed by SDNN: individual values at baseline and at 55 weeks.
Notes: (A) Observed values of SDNN (ms). (B) SDNN Z-scores. SDNN represents the standard deviation of all filtered RR intervals for the length of the analysis. The different colored shapes within the figure show individual patient data at baseline and 55 weeks.
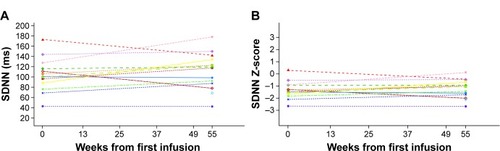
Figure 2 LVMI over time for the patient who had LVH at baseline.
Note: SDNN represents the standard deviation of all filtered RR intervals for the length of the analysis.
Abbreviations: LVH, left ventricular hypertrophy; LVMI, left ventricular mass index.
Abbreviations: LVH, left ventricular hypertrophy; LVMI, left ventricular mass index.
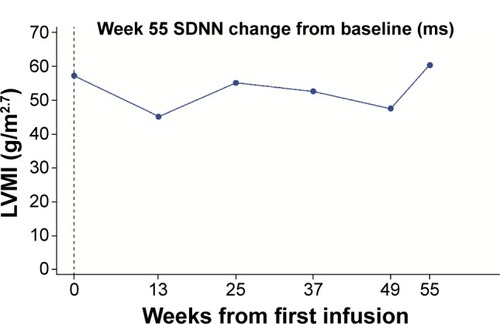
Figure 3 Correlation between change from baseline to week 55 in SDNN and LVMI in patients with baseline SDNN <100 ms.
Notes: *r = Pearson correlation coefficient. SDNN represents the standard deviation of all filtered RR intervals for the length of the analysis.
Abbreviation: LVMI, left ventricular mass index.
Abbreviation: LVMI, left ventricular mass index.
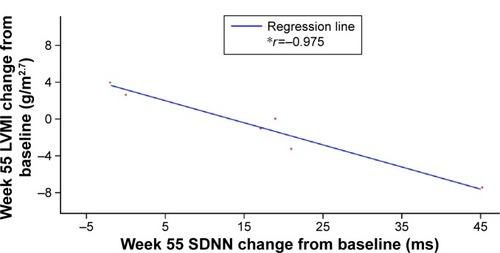
Figure 4 Mean (SE) change from baseline in eGFR.
Note: The safety population comprises all enrolled patients who received at least one dose of agalsidase alfa.
Abbreviations: eGFR, estimated glomerular filtration rate; SE, standard error; SP, safety population.
Abbreviations: eGFR, estimated glomerular filtration rate; SE, standard error; SP, safety population.
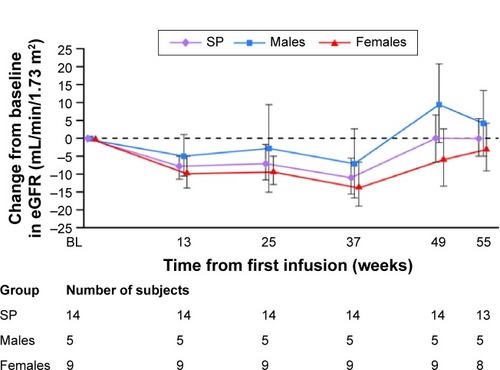
Figure 5 Mean plasma Gb3 over time for the overall population and by sex.
Notes: (A) Observed values (nmol/mL). (B) Change from baseline.
Abbreviation: Gb3, globotriaosylceramide.
Abbreviation: Gb3, globotriaosylceramide.
