Figures & data
Figure 1 The flow chart of the study.
Notes: The AFLD model was established using LDA. CG is the control group, in which the mice were fed with Lieber–DeCarli (LD) diet; MG is the model group, in which the mice were fed with LD diet and alcohol; SI is a model group, in which SIRT1 gene was silenced in the model mice; BJ is a model group, in which the model mice were fed with blueberry juice; BJSI is a model group, in which SIRT1 gene was silenced in the model mice and the mice were fed with blueberry juice. BJP is a model group, in which the model mice were fed with blueberry juice and probiotics; BJPSI is a model group, in which SIRT1 gene was silenced in model mice and the mice were fed with blueberry juice and probiotics.
Abbreviations: SOD, superoxide dismutase; GSH, reduced glutathione; AST, aspartate aminotransferase; ALT, alanine aminotransferase; TG, total triglyceride; TC, total cholesterol; HDL-C, high-density lipoprotein-cholesterol; LDL-C, low-density lipoprotein-cholesterol; MDA, malondialdehyde; LDA, Lieber–DeCarli diet and alcohol; MG, model group; SI, SIRT1 siRNA group; SIRT1, sirtuin type 1; BJ, blueberry juice group; BJSI, blueberry juice and SIRT1 siRNA group; BJP, blueberry juice and probiotics group; BJPSI, blueberry juice, probiotics, and SIRT1 siRNA group; qRT-PCR, quantitative reverse transcription–polymerase chain reaction; NAFLD, nonalcoholic fatty liver disease.
Abbreviations: SOD, superoxide dismutase; GSH, reduced glutathione; AST, aspartate aminotransferase; ALT, alanine aminotransferase; TG, total triglyceride; TC, total cholesterol; HDL-C, high-density lipoprotein-cholesterol; LDL-C, low-density lipoprotein-cholesterol; MDA, malondialdehyde; LDA, Lieber–DeCarli diet and alcohol; MG, model group; SI, SIRT1 siRNA group; SIRT1, sirtuin type 1; BJ, blueberry juice group; BJSI, blueberry juice and SIRT1 siRNA group; BJP, blueberry juice and probiotics group; BJPSI, blueberry juice, probiotics, and SIRT1 siRNA group; qRT-PCR, quantitative reverse transcription–polymerase chain reaction; NAFLD, nonalcoholic fatty liver disease.
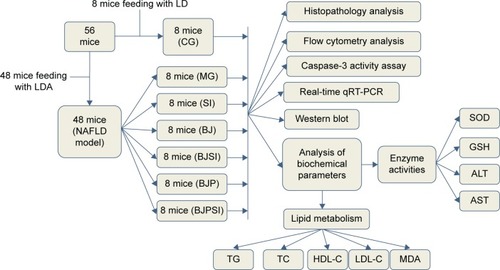
Table 1 The primers used in qRT-PCR
Figure 2 Effect of blueberry juice and probiotics on AFLD and liver damage.
Notes: All hepatic samples were stained with HE (marked as “H”) or Oil Red O (marked as “O”) to evaluate the severity of AFLD (original magnification: ×200). CG (H): in the control group, hepatocytes are arranged radially around a vein in the center and hepatic structure is clearly visible. Few small-sized cavities are found. CG (O): in the control group, small-sized lipid droplets are observed. MG (H): in the model group, hepatic cords were heavily destroyed and many cavities were observed. MG (O): in the model group, many lipid droplets were visible. SI (H): in the SIRT1-RNAi group, hepatic cords were completely destroyed and many large-sized cavities were produced. SI (O): in the SIRT1-RNAi group, many large-sized lipid droplets were produced. BJ (H): in the blueberry juice group, the structure of hepatic cords was slightly repaired and arranged around the vein in the center. A few small-sized cavities appeared. BJ (O): in the blueberry juice group, many small-sized lipid droplets were produced. BJSI (H): in the blueberry juice and SIRT1-RNAi group, hepatic cords were destroyed and middle-sized cavities were produced. BJSI (O): in the blueberry juice and SIRT1-RNAi group, many middle-sized lipid droplets were found. BJP (H): in the blueberry juice and probiotics group, the destroyed hepatic cords were repaired well and radially arranged around the vein in the center. Fewer small cavities were produced. BJP (O): in the blueberry juice and probiotics group, fewer small-sized lipid droplets were produced. BJPSI (H): in the blueberry juice, probiotics, and SIRT1-RNAi group, the hepatic cords were destroyed. Small- and middle-sized cavities were observed. BJPSI (O): in the blueberry juice, probiotics, and SIRT1-RNAi group, many small-sized lipid droplets were produced.
Abbreviations: AFLD, alcoholic fatty liver disease; HE, hematoxylin and eosin; MG, model group; BJ, blueberry juice group; BJSI, blueberry juice and SIRT1 siRNA group; BJP, blueberry juice and probiotic bacteria group; BJPSI, blueberry juice, probiotics, and SIRT1 siRNA group; RNAi, RNA interference.
Abbreviations: AFLD, alcoholic fatty liver disease; HE, hematoxylin and eosin; MG, model group; BJ, blueberry juice group; BJSI, blueberry juice and SIRT1 siRNA group; BJP, blueberry juice and probiotic bacteria group; BJPSI, blueberry juice, probiotics, and SIRT1 siRNA group; RNAi, RNA interference.
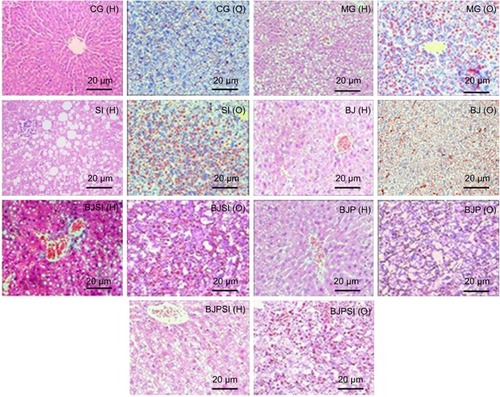
Figure 3 Apoptosis of hepatic tissues.
Notes: CG is the control group, in which the mice were fed with Lieber–DeCarli diet; MG is the model group, in which the mice were fed with Lieber–DeCarli diet and alcohol; SI is a model group, in which SIRT1 gene was silenced in the model mice; BJ is a model group, in which the model mice were fed with blueberry juice; BJSI is a model group, in which SIRT1 gene was silenced in the model mice and the mice were fed with blueberry juice. BJP is a model group, in which the model mice were fed with blueberry juice and probiotics; BJPSI is a model group, in which SIRT1 gene was silenced in model mice and the mice were fed with blueberry juice and probiotics. Panel A shows the apoptotic rates in different groups. All data are presented as mean value ± SD and n=8 in each group. *P<0.05 vs control group and #P<0.05 vs model group. ANOVA was performed to compare the mean values from different groups.
Abbreviations: CG, control group; MG, model group; BJ, blueberry juice group; SI, SIRT1 siRNA group; SIRT1, sirtuin type 1; BJSI, blueberry juice and SIRT1 siRNA group; BJP, blueberry juice and probiotic bacteria group; BJPSI, blueberry juice, probiotics, and SIRT1 siRNA group; FITC, fluorescein isothiocyanate; SD, standard deviation; PI-A, Propidium Iodide-A.
Abbreviations: CG, control group; MG, model group; BJ, blueberry juice group; SI, SIRT1 siRNA group; SIRT1, sirtuin type 1; BJSI, blueberry juice and SIRT1 siRNA group; BJP, blueberry juice and probiotic bacteria group; BJPSI, blueberry juice, probiotics, and SIRT1 siRNA group; FITC, fluorescein isothiocyanate; SD, standard deviation; PI-A, Propidium Iodide-A.
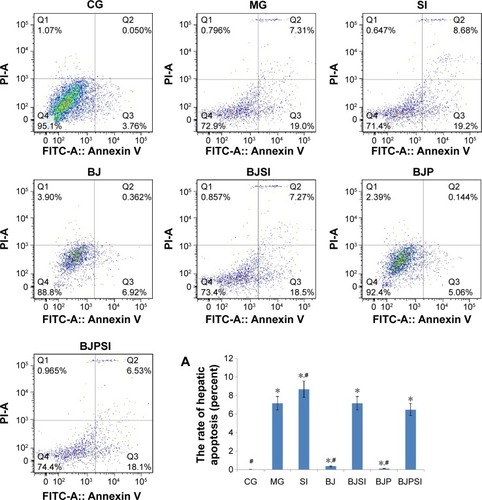
Table 2 Serum biochemical indexes in all groups
Table 3 Biochemical indexes of liver tissues
Figure 4 Real-time quantitative RT-PCR analysis of the mRNA levels of SIRT1, FOXO1, FasL, caspase-3, BAX, and Bcl-2.
Notes: CG is the control group, in which the mice were fed Lieber–DeCarli diet; MG is the model group, in which the mice were fed Lieber–DeCarli diet and alcohol; SI is a model group, in which SIRT1 gene was silenced in the model mice; BJ is a model group, in which the model mice were fed blueberry juice; BJSI is a model group, in which SIRT1 gene was silenced in the model mice and the mice were fed blueberry juice. BJP is a model group, in which the model mice were fed blueberry juice and probiotics; BJPSI is a model group, in which SIRT1 gene was silenced in model mice and the mice were fed blueberry juice and probiotics. All data are presented as mean value ± SD and n=8 in each group. *P<0.05 vs control group and #P<0.05 vs MG. ANOVA was performed to compare the mean values from different groups.
Abbreviations: BAX, BCL2-associated X protein; Bcl-2, B-cell lymphoma 2; RT-PCR, reverse transcription-polymerase chain reaction; CG, control group; MG, model group; BJ, blueberry juice group; SI, SIRT1 siRNA group; SIRT1, sirtuin type 1; BJSI, blueberry juice and SIRT1 siRNA group; BJP, blueberry juice and probiotic bacteria group; BJPSI, blueberry juice, probiotics, and SIRT1 siRNA group; FOXO1, forkhead box protein O1; FasL, tumor necrosis factor ligand superfamily member 6; SD, standard deviation.
Abbreviations: BAX, BCL2-associated X protein; Bcl-2, B-cell lymphoma 2; RT-PCR, reverse transcription-polymerase chain reaction; CG, control group; MG, model group; BJ, blueberry juice group; SI, SIRT1 siRNA group; SIRT1, sirtuin type 1; BJSI, blueberry juice and SIRT1 siRNA group; BJP, blueberry juice and probiotic bacteria group; BJPSI, blueberry juice, probiotics, and SIRT1 siRNA group; FOXO1, forkhead box protein O1; FasL, tumor necrosis factor ligand superfamily member 6; SD, standard deviation.
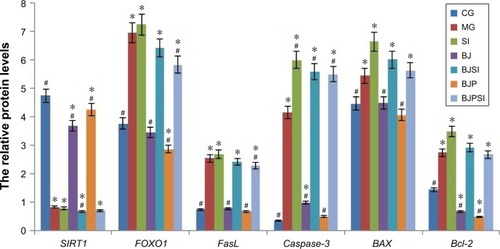
Figure 5 Western blot analysis of the protein levels of SIRT1, FOXO1, phosphorylated FOXO1 (P-FOXO1), acetylated-FOXO1 (Ac-FOXO1), FasL, and caspase-3.
Notes: CG is the control group, in which the mice were fed Lieber–DeCarli diet; MG is the model group, in which the mice were fed Lieber–DeCarli diet and alcohol; SI was the model group, in which SIRT1 gene was silenced in the model mice; BJ is a model group, in which the model mice were fed with blueberry juice; BJSI is a model group, in which SIRT1 gene was silenced in the model mice and the mice were fed with blueberry juice. BJP is a model group, in which the model mice were fed with blueberry juice and probiotics; BJPSI is a model group, in which SIRT1 gene was silenced in model mice and the mice were fed with blueberry juice and probiotics. All data are presented as mean value ± SD and n=8 in each group. *P<0.05 vs control group and #P<0.05 vs MG. ANOVA was performed to compare the mean values from different groups.
Abbreviations: CG, control group; MG, model group; BJ, blueberry juice group; SI, SIRT1 siRNA group; SIRT1, sirtuin type 1; BJSI, blueberry juice and SIRT1 siRNA group; BJP, blueberry juice and probiotic bacteria group; BJPSI, blueberry juice, probiotics, and SIRT1 siRNA group; FOXO1, forkhead box protein O1; FasL, tumor necrosis factor ligand superfamily member 6; BAX, BCL2-associated X protein; Bcl-2, B-cell lymphoma 2; SD, standard deviation.
Abbreviations: CG, control group; MG, model group; BJ, blueberry juice group; SI, SIRT1 siRNA group; SIRT1, sirtuin type 1; BJSI, blueberry juice and SIRT1 siRNA group; BJP, blueberry juice and probiotic bacteria group; BJPSI, blueberry juice, probiotics, and SIRT1 siRNA group; FOXO1, forkhead box protein O1; FasL, tumor necrosis factor ligand superfamily member 6; BAX, BCL2-associated X protein; Bcl-2, B-cell lymphoma 2; SD, standard deviation.
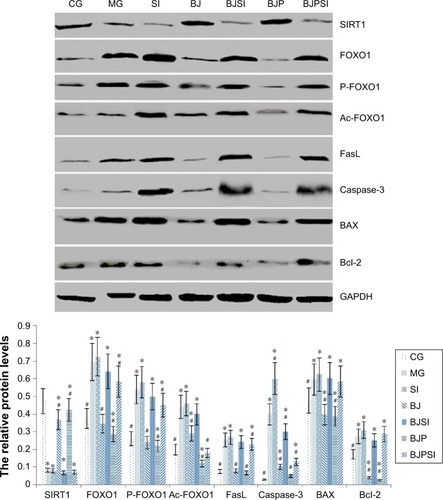
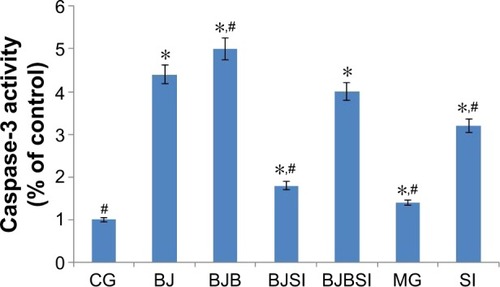
Figure 6 The effects of blueberry juice and probiotics on the activity of caspase-3.
Notes: CG is the control group, in which the mice were fed Lieber–DeCarli diet; MG is the model group, in which the mice were fed Lieber–DeCarli diet and alcohol; SI was the group, in which SIRT1 gene was silenced in the model mice; BJ is the group, in which the model mice were fed with blueberry juice; BJSI is the group, in which SIRT1 gene was silenced in the model mice and the mice were fed with blueberry juice. BJP is the group, in which the model mice were fed with blueberry juice and probiotics; BJPSI is the group, in which SIRT1 gene was silenced in model mice and the mice were fed with blueberry juice and probiotics. All data are presented as mean value ± SD and n=8 in each group. *P<0.05 vs a control group; #P<0.05 vs a model group. ANOVA was performed to compare the mean values from different groups.
Abbreviations: CG, control group; MG, model group; BJ, blueberry juice group; SI, SIRT1 siRNA group; SIRT1, sirtuin type 1; BJSI, blueberry juice and SIRT1 siRNA group; BJP, blueberry juice and probiotic bacteria group; BJPSI, blueberry juice, probiotics, and SIRT1 siRNA group; SD, standard deviation.
Abbreviations: CG, control group; MG, model group; BJ, blueberry juice group; SI, SIRT1 siRNA group; SIRT1, sirtuin type 1; BJSI, blueberry juice and SIRT1 siRNA group; BJP, blueberry juice and probiotic bacteria group; BJPSI, blueberry juice, probiotics, and SIRT1 siRNA group; SD, standard deviation.