Figures & data
Table 1 Primer sequences used for real-time polymerase chain reaction
Figure 1 Effects of PDGF plus TNF-α and zoledronate (48 hours) on MMP-2, -9, and -13.
Notes: (A) MMP-2 mRNA expression. ***P≤0.001, *P≤0.05 vs Control-Untreated, n=3. (B) MMP-2 and MMP-9 protein expressions. A representative zymogram a: No induction; b: PDGF (50 ng/mL) + TNF-α-induced (10 ng/mL); c: PDGF (50 ng/mL) + TNF-α-induced (50 ng/mL). (C) MMP-9 mRNA expression. **P≤0.01, ***P≤0.001 vs Control-untreated, ##P≤0.01 vs control-zoledronate (n=3). (D) MMP-13 mRNA expression **P≤0.01, ***P≤0.001 vs control untreated, ##P≤0.01 vs control-zoledronate (n=3). (E) Protein expression of MMP-13 by Western blotting. Lanes No induction (c); Zoledronate (100 μM) (z); PDGF (50 ng/mL) + TNF-α-induced (50 ng/mL) (p+t); PDGF + TNF-α + Zoledronate (p+t+z).
Abbreviation: EDTA, ethylenediaminetetraacetic acid.
Abbreviation: EDTA, ethylenediaminetetraacetic acid.
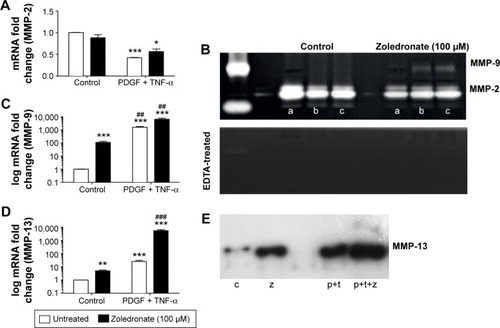
Figure 2 Evidence for involvement of the NF-κB pathway.
Notes: (A) Effects of IκB kinase 2 inhibitor SC-514 (50 μM) were measured on MMP-9 mRNA expression. ***P≤0.001 untreated vs PDGF plus TNF-α induction, ###P≤0.001 untreated vs SC-514 (n=4). (B) Effects of SC-514 (50 μM) were measured on MMP-13 mRNA expression. ***P≤0.001 untreated vs PDGF plus TNF-α induction, ###P≤0.001 untreated vs SC-514 (n=4). (C) Effects of PDGF plus TNF-α induction and zoledronate treatment (48 hours) were measured on IκBα mRNA expression levels. ***P≤0.01 vs control – untreated, #P≤0.05 untreated vs SC-514 (n=3).
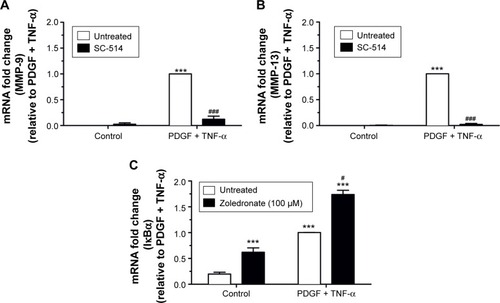
Figure 3 Effects of zoledronate on ROS levels in rat VSMCs and aortic rings.
Notes: (A) ROS levels determined by dichlorofluorescein (DCF) fluorescence were compared in control (c), PDGF (50 ng/mL) plus TNF-α (10 ng/mL) induced (pt) and zoledronate pre-treated (zol, 100 μM) cells. *P≤0.05 control vs zoledronate (n=4). (B) Lucigenin or luminol enhanced chemiluminescence was measured in control and 100 μM zoledronate pre-treated isolated rat aortic rings. *P≤0.05 control vs zoledronate, paired Student’s t-test, (n=5).
Abbreviations: ROS, reactive oxygen species; VSMCs, vascular smooth muscle cells; AUC, area under curve; RLU, relative light units.
Abbreviations: ROS, reactive oxygen species; VSMCs, vascular smooth muscle cells; AUC, area under curve; RLU, relative light units.
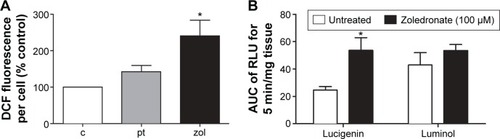
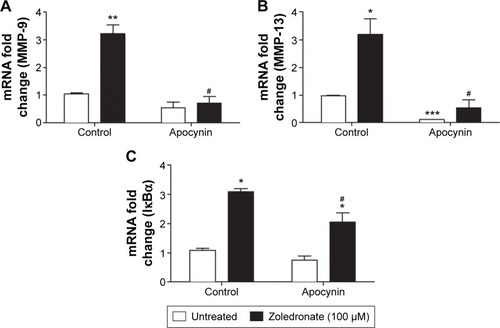
Figure 4 Effects of apocynin with and without zoledronate on MMP-9, -13, and IκBα.
Notes: (A) MMP-9 mRNA expression. **P≤0.01, #P≤0.05 vs control – zoledronate. (B) MMP-13 mRNA expression. *P≤0.05, ***P≤0.01 vs control – untreated, #P≤0.05 vs control – zoledronate. (C) IκBα mRNA expression. *P≤0.05 vs control – untreated; #P≤0.05 control vs apocynin (n=4).