Figures & data
Table 1 Composition of different PLO gels loaded with silymarin
Figure 1 FTIR spectroscopy.
Abbreviations: FTIR, Fourier transform infrared spectroscopy; PLO, pluronic-lecithin organogel.
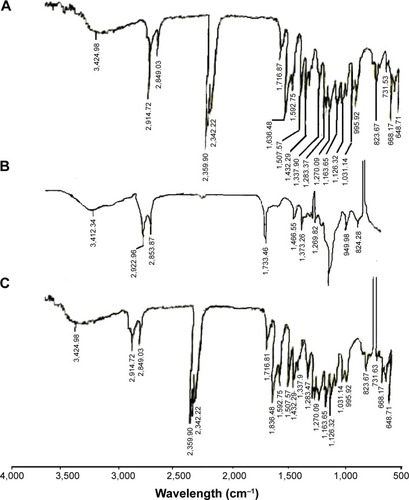
Table 2 Physicochemical properties of different PLO gels loaded with silymarin
Figure 2 Rheology behaviors of different PLO gels loaded with silymarin.
Abbreviations: PLO, pluronic-lecithin organogel; DMSO, dimethyl sulfoxide.
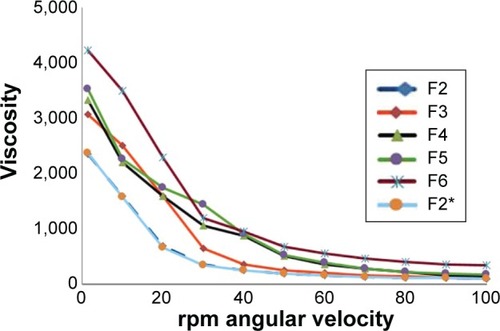
Figure 3 In vitro release of silymarin from different formulations of PLO gels.
Abbreviations: PLO, pluronic-lecithin organogel; hr, hours; DMSO, dimethyl sulfoxide.
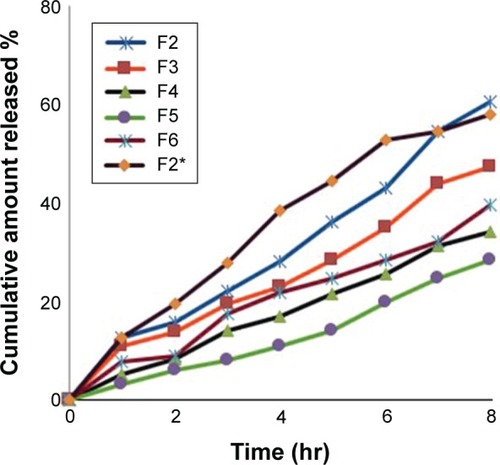
Figure 4 Ex vivo permeability release (XF2, XF2*) compared with the in vitro release (F2, F2*) of silymarin from PLO gels.
Abbreviations: PLO, pluronic-lecithin organogel; hr, hours.
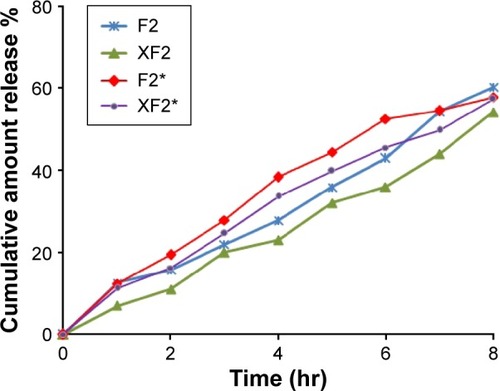
Table 3 Clinical phase, severity, and distribution of AD lesions among patients
Figure 5 Photographs of different AD patients before and after treatment with silymarin loaded PLO gels.
0
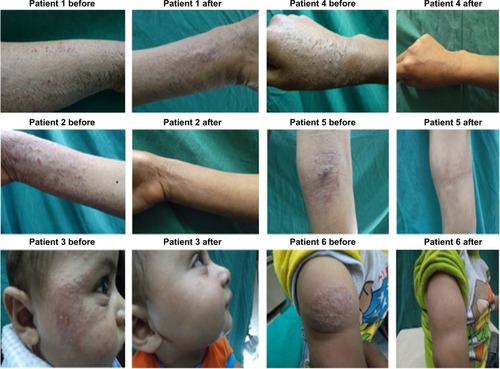
Figure 6 Comparison between control side and treated side with regards to itching.
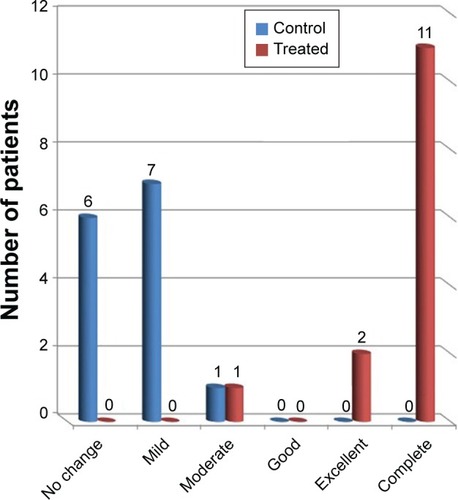
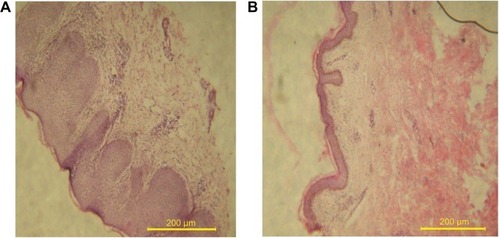
Figure 7 Patient’s skin histology.
Abbreviation: PLO, pluronic-lecithin organogel.