Figures & data
Figure 1 Effects of UA on neurological deficit scores and the infarct volume.
Notes: (A) UA (5, 10, or 20 mg/kg) improved neurological deficit scores (##P<0.01). With increasing UA concentrations, the neurological deficit scores were further reduced, and the median neurological deficit score was further decreased. BADGE significantly abolished the UA-induced improvement in neurological deficits (+P<0.05). However, the BADGE co-treatment groups also showed less severe neurological impairments than the control group (##P<0.01). (B) UA (5, 10, or 20 mg/kg) reduced the infarct volume (##P<0.01), and the relative infarct size decreased with increasing UA concentrations. BADGE co-treatment significantly (++P<0.01) attenuated the change in infarct volume in (C) brain slices that were stained with TTC but did not return the infarct size to control levels (##P<0.01). Red tissue is healthy; white tissue is infarcted. We displayed the third slice from the anterior portion of the brain (about bregma level) to show the clear differences between the groups. Mean values ± standard error of the mean for 18 (neurological deficit score) or six rats per group (**P<0.01: versus sham; ##P<0.01: versus control; ++P<0.01: versus UA treated; +P<0.05: versus UA-treated).
Abbreviations: UA, ursolic acid; BADGE, bisphenol A diglycidyl ether; TTC, 2,3,5-triphenyltetrazolium chloride.
Abbreviations: UA, ursolic acid; BADGE, bisphenol A diglycidyl ether; TTC, 2,3,5-triphenyltetrazolium chloride.
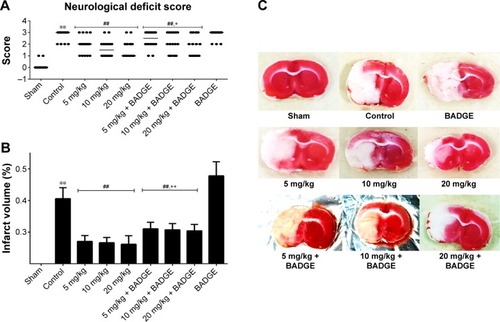
Figure 2 Effect of UAtreatment on brain damage in rats.
Notes: (A) Nissl staining. Nissl bodies were stained violet. The black arrows indicate the morphology of normal neurons. The normal neurons were intact with clear borders, compact structure, abundant cytoplasm, and bodies. (B) Nissl staining of cerebral cortical neurons of rats in different groups. 400× magnification. (C) After MCAO/R, the number of intact neurons was decreased and the number of injured neurons displaying cell shrinkage was increased (**P<0.01). UAtreatment increased the number of intact neurons in a dose-dependent manner (##P<0.01). BADGE co-treatment significantly (++P<0.01) but partially (##P<0.01) blocked the therapeutic effect of U. (D) The number of intact neurons was increased with increasing UA concentrations from 5 to 20 mg/kg. The differences between the UA-treated groups (5, 10, and 20 mg/kg) were significant (P<0.01). Mean values ± standard error of the mean for six rats per group (**P<0.01: versus sham; ##P<0.01: versus control; ++P<0.01: versus UA-treated).
Abbreviations: UA, ursolic acid; BADGE, bisphenol A diglycidyl ether; MCAO/R, middle cerebral artery occlusion and reperfusion.
Abbreviations: UA, ursolic acid; BADGE, bisphenol A diglycidyl ether; MCAO/R, middle cerebral artery occlusion and reperfusion.
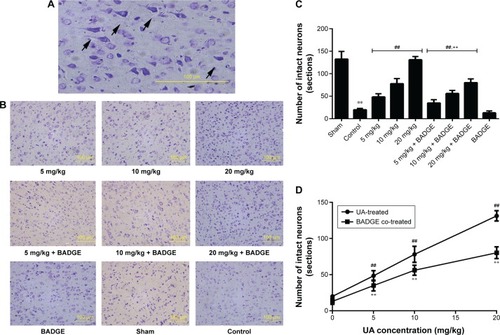
Figure 3 Effect of UA on the PPARγ protein levels.
Notes: Cerebral ischemia and reperfusion injury decreased the PPARγ protein levels in the control group compared to the sham group (**P<0.01). UA treatment (5, 10, or 20 mg/kg) increased the number of PPARγ-positive cells and the PPARγ protein levels in a dose-dependent manner based on immunochemical and Western blot analyses, respectively (##P<0.01). BADGE abolished the UA-induced change in PPARγ expression (++P<0.01), and UA co-administered with BADGE yielded PPARγ levels similar to the control levels. (A) PPARγ protein expression was confirmed by immunohistochemical staining. The black arrows indicate PPARγ-positive cells in which PPARγ had translocated to the nucleus. (B) Immunochemical staining for PPARγ in different groups. UA treatment (5, 10, or 20 mg/kg) induced PPARγ translocation into the nucleus (##P<0.01). 400× magnification. (C) The protein level of PPARγ was measured by Western blotting. (D) Quantification of PPARγ-positive cells in each group. UA increased the percentage of PPARγ-positive cells (##P<0.01). The percentage of PPARγ-positive cells increased with increasing UA concentrations. BADGE co-treatment abolished this change. (E) The target protein bands were analyzed via densitometry and normalized to the GADPH levels. (F) The PPARγ/GADPH band intensity ratio increased with increasing UA concentration. The differences between the UA-treated groups (5, 10, and 20 mg/kg) were significant. Mean values ± standard error of the mean for six rats per group (**P<0.01: versus sham; ##P<0.01: versus control; ++P<0.01: versus UA-treated).
Abbreviations: UA, ursolic acid; BADGE, bisphenol A diglycidyl ether.
Abbreviations: UA, ursolic acid; BADGE, bisphenol A diglycidyl ether.
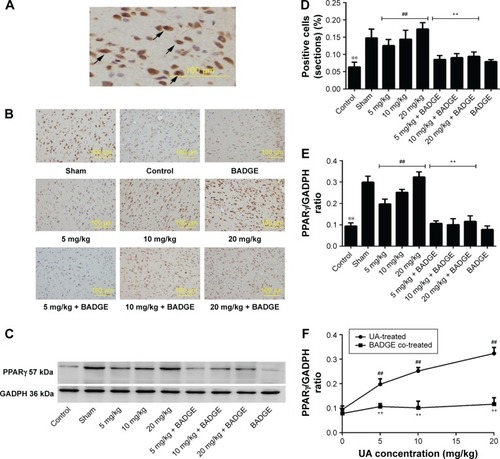
Figure 4 Effects of UA on MMP2 and MMP9.
Notes: Cerebral ischemia and reperfusion increased the protein levels of MMP2 and MMP9 (**P<0.01). UA treatment (5, 10, or 20 mg/kg) decreased the protein levels of MMP2 and MMP9 and the activity level of MMP9 in a dose-dependent manner (##P<0.01). BADGE completely abolished the UA-induced reduction in the MMP2 protein level (++P<0.01) and partly abolished the reduction in the MMP9 level (##P<0.01). (A) The protein expression of MMP2 and MMP9 was confirmed via immunochemical staining. (B) The protein expression of MMP2 and MMP9 was measured by Western blotting 400× magnification. We distinguished the active form of MMP9 from its inactive form. (C, D) The target protein bands were analyzed via densitometry and normalized to the GADPH levels. (E, F) The MMP/GADPH band intensity ratio decreased with increasing UA concentrations, and this effect on MMPs significantly differed between the UA-treated groups. Mean values ± standard error of the mean for six rats per group (**P<0.01: versus sham; ##P<0.01: versus control; ++P<0.01: versus UA-treated; +P<0.05: versus UA-treated).
Abbreviations: UA, ursolic acid; BADGE, bisphenol A diglycidyl ether.
Abbreviations: UA, ursolic acid; BADGE, bisphenol A diglycidyl ether.
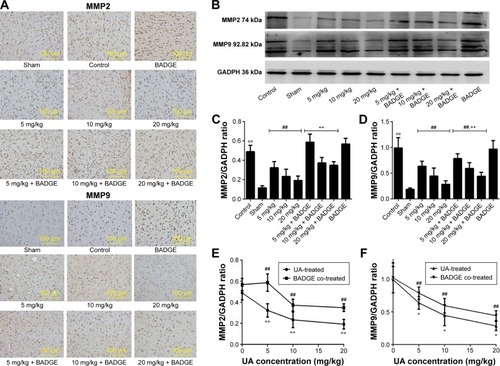
Figure 5 Effect of UA on TIMP1.
Notes: The protein level of TIMP1 was downregulated after cerebral ischemia and reperfusion injury (**P<0.01). UA (5, 10, or 20 mg/kg) treatment increased the TIMP1 protein level in a dose-dependent manner (##P<0.01). BADGE significantly (##P<0.01) but partially (++P<0.01) attenuated the UA-induced change in TIMP1 expression. (A) The protein level of TIMP1 was confirmed via immunochemical staining. (B) The protein level of TIMP1 was measured by Western blotting. (C) The target protein bands were analyzed via densitometry and normalized to the GADPH levels. (D) The TIMP1/GADPH band intensity ratio increased with increasing UA concentration, and the differences between the UA-treated groups were significant. Mean values ± standard error of the mean for six rats per group (**P<0.01: versus sham; ##P<0.01: versus control; ++P<0.01: versus UA-treated). 400× magnification.
Abbreviations: UA, ursolic acid; BADGE, bisphenol A diglycidyl ether.
Abbreviations: UA, ursolic acid; BADGE, bisphenol A diglycidyl ether.
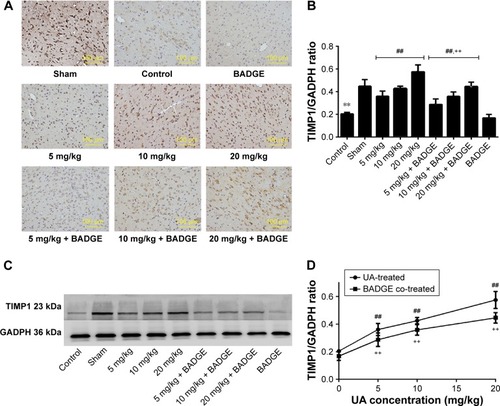
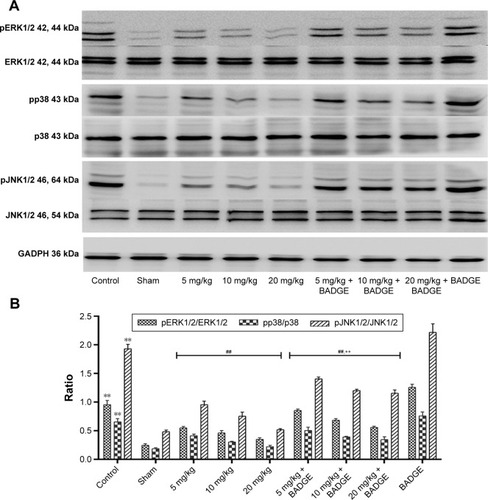
Figure 6 Effect of UA on the MAPK signaling pathway.
Notes: Western blot analysis showed significantly higher levels of pERK1/2, pJNK1/2, and pp38 in the control group than in the sham group (**P<0.01). UA treatment (5, 10, or 20 mg/kg) decreased the pERK1/2, pJNK1/2, and pp38 protein levels (##P<0.01). MAPK activation decreased with increasing UA concentrations. BADGE blocked the UA-induced activation of MAPKs either completely (++P<0.01) or partially (##P<0.01) depending on the UA concentration. (A) The protein level of MAPK was measured by Western blotting. (B) The target protein bands were analyzed via densitometry and normalized to the GADPH levels. Mean values ± standard error of the mean for six rats per group (**P<0.01: versus sham; ##P<0.01: versus control; ++P<0.01: versus UA-treated).
Abbreviations: UA, ursolic acid; MAPK, mitogen-activated protein kinase; BADGE, bisphenol A diglycidyl ether.
Abbreviations: UA, ursolic acid; MAPK, mitogen-activated protein kinase; BADGE, bisphenol A diglycidyl ether.