
Figures & data
Table 1 Mean hydrodynamic diameter and PDI of NLC, M-NLC, NLC-RFB, and M-NLC-RFB formulations
Table 2 Characterization of the zeta-potential of the NLC, M-NLC, NLC-RFB, and M-NLC-RFB formulations
Table 3 Drug’s encapsulation efficiency of the NLC-RFB and M-NLC-RFB formulations
Figure 1 Cryo-SEM images of (A) NLC, (B) M-NLC, and (C) M-NLC-RFB at 20,000× magnification.
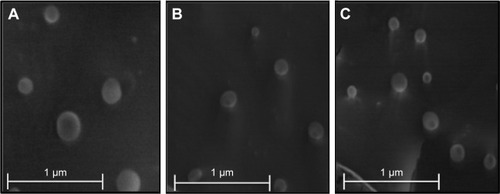
Figure 2 Second-derivative FT-IR spectra of M-NLC-RFB formulation.
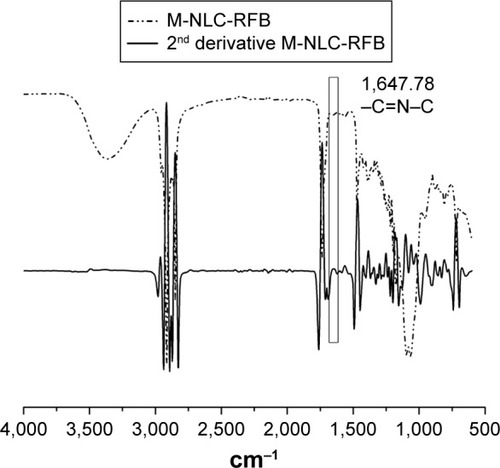
Figure 3 In vitro RFB release profiles from NLC (A) and M-NLC (B) at three different pH values, pH =5.0, 6.2, and 7.4, at body temperature (37°C).
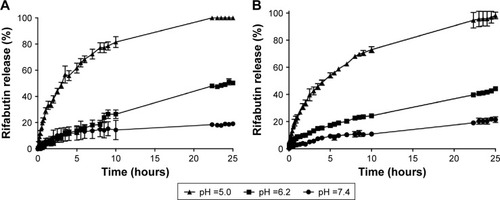
Table 4 Cell viability in RAW, A549, and Calu-3 cells as a function of NLC, M-NLC, and M-NLC-RFB in concentrations of the lyophilized formulations (1, 10, 100, and 1,000 mg/mL) expressed in log10
Table 5 Characterization of the hydrodynamic diameter, polydispersity index, and zeta-potential after 0, 1, and 6 months of the synthesis of NLC-RFB and M-NLC-RFB lyophilized formulations
Table S1 Value of R2 obtained from the release of RFB from the NLC-RFB lyophilized formulation for different models of mechanism of drug release
Table S2 Value of R2 obtained from the release of RFB from the M-NLC-RFB lyophilized formulation for different models of mechanism of drug release