
Figures & data
Table 1 Relationship between the commonest genotypes and AAT serum concentration
Table 2 Purified AAT products currently licensed for intravenous administration
Table 3 Summary of studies to assess efficacy of AAT augmentation therapy
Figure 1 Voxel frequency distribution histogram showing the appearance of normal lung (black line) and emphysema (gray line) and the derivation of the commonest densitometric indices.
Notes: The 15th percentile point (PD15) is defined as the cutoff value, in HU, below which 15% of voxels with the lowest density are distributed. This index becomes more negative with emphysema progression. The voxel index at a threshold of −950 HU (VI-950), defined as the percentage of voxels with a value less than −950 HU, increases with emphysema progression.
Abbreviation: HU, Hounsfield unit.
Abbreviation: HU, Hounsfield unit.
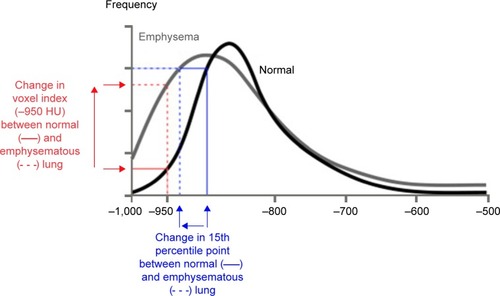
Figure 2 Change from baseline in 15th percentile lung density (PD15), over the course of the RAPID study (RAPID-RCT and RAPID-OLE).
Notes: Data are from the mixed-effect regression model applied to each trial separately (RAPID-OLE ITT population). Adjusted PD15, lung volume-adjusted 15th percentile of the lung density. Reprinted from The Lancet Respiratory, 5(1), McElvaney et al, Long-term efficacy and safety of alpha-1 proteinase inhibitor treatment for emphysema cause by severe alpha-1 antitrypsin: an open label extension trial (RAPID-OLE).Citation51–Citation60, Copyright 2016, with permission from Elsevier.Citation57
Abbreviations: ITT, intention to treat; TLC, total lung capacity; RCT, randomized controlled trial; OLE, open-label extension.
Abbreviations: ITT, intention to treat; TLC, total lung capacity; RCT, randomized controlled trial; OLE, open-label extension.
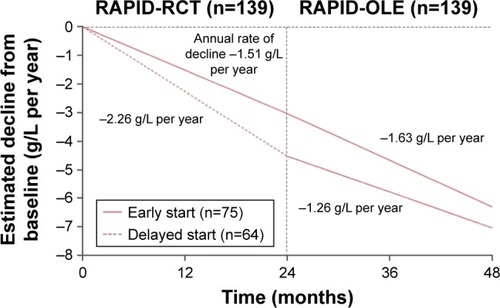
Table 4 Summary of key points from different AATD guidelines