Figures & data
Figure 1 AAA attenuates AOH-induced retinal apoptosis.
Notes: TUNEL (A–D) stainings were performed after 5 days of AOH. Cell nuclei were counterstained with Hoechst. The results showed that AOH caused significant increase in TUNEL-positive cells (C and I), but AAA could abolish this effect (scale bar =50 μm; n=4 per group). The green dot indicated by the arrow is an apoptotic cell and the blue areas indicate cell nuclei.
Abbreviations: AAA, α-aminoadipic acid; AOH, acute ocular hypertension; TUNEL, terminal deoxynucleotidyl transferase-mediated uridine 5′-triphosphate-biotin nick end labeling; Ctrl, control.
Abbreviations: AAA, α-aminoadipic acid; AOH, acute ocular hypertension; TUNEL, terminal deoxynucleotidyl transferase-mediated uridine 5′-triphosphate-biotin nick end labeling; Ctrl, control.
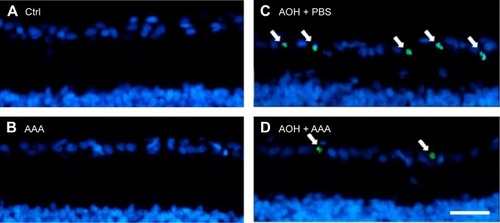
Figure 2 AAA rescued AOH-reduced number of RGCs.
Notes: Retinas were collected after 5 days of AOH, and Thy-1 staining was performed. Cell nuclei were counterstained with Hoechst. The number of Thy-1-positive RGCs was quantified. In the rat model of AOH, the number of RGCs was significantly decreased and AAA restored the number of RGCs (scale bar =50 μm; n=4 per group).
Abbreviations: AAA, α-aminoadipic acid; AOH, acute ocular hypertension; RGCs, retinal ganglion cells; Ctrl, control; PBS, phosphate-buffered saline.
Abbreviations: AAA, α-aminoadipic acid; AOH, acute ocular hypertension; RGCs, retinal ganglion cells; Ctrl, control; PBS, phosphate-buffered saline.
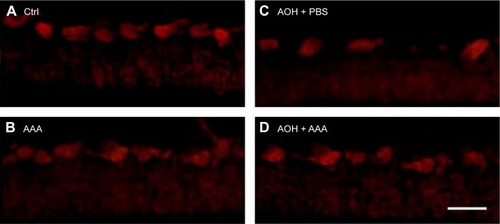
Figure 3 AAA attenuated induced Müller gliosis in the rat model of AOH.
Notes: (A) AAA attenuated increased GFAP immunoreactivity in the Müller cells of retina of the rat model of AOH after 1 d, 3 d, and 5 d of intravitreal AAA treatment (250 μg/eye; scale bar =50 μm). (B) Quantitative analysis of fluorescence intensity of GFAP. *P<0.05 compared with the AOH 1 d group (n=4 per group).
Abbreviations: AAA, α-aminoadipic acid; AOH, acute ocular hypertension; GFAP, glial fibrillary acidic protein; d, day; Ctrl, control; GCL, ganglion cell layer; IPL, inner plexiform layer.
Abbreviations: AAA, α-aminoadipic acid; AOH, acute ocular hypertension; GFAP, glial fibrillary acidic protein; d, day; Ctrl, control; GCL, ganglion cell layer; IPL, inner plexiform layer.
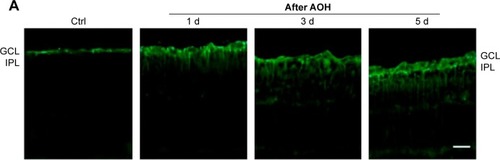
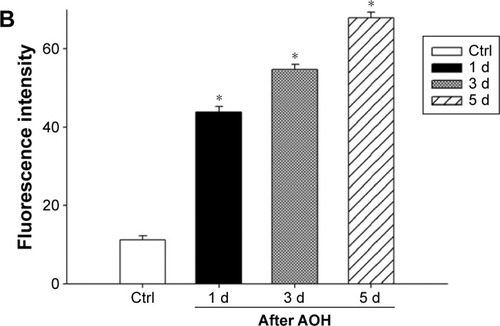
Figure 4 AAA treatment reduced the induction of TNF-α in AOH retinas.
Notes: (A) Western blot results showed the effect of AAA on TNF-α protein expression in retinas after 5 d of AOH. (B) Quantitative analysis of protein expression levels of TNF-α (n=4 per group). *P<0.05 compared with the Ctrl group (no AOH induction). **P<0.05 compared with the AOH + PBS group.
Abbreviations: AAA, α-aminoadipic acid; TNF-α, tumor necrosis factor-α; d, days; AOH, acute ocular hypertension; Ctrl, control; PBS, phosphate-buffered saline.
Abbreviations: AAA, α-aminoadipic acid; TNF-α, tumor necrosis factor-α; d, days; AOH, acute ocular hypertension; Ctrl, control; PBS, phosphate-buffered saline.
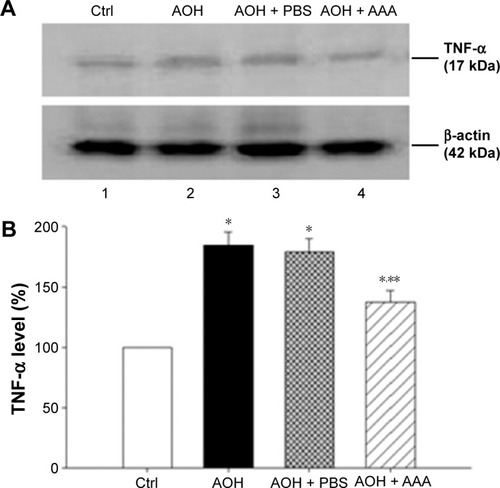
Figure 5 A schematic flow chart of AAA protection in the rat model of AOH.
Notes: In the rat model of AOH, acute elevation of IOP induced Müller cell gliosis and TNF-α production, leading to RGC apoptosis. AAA treatment reduced Müller cell gliosis and TNF-α production to protect RGCs.
Abbreviations: AAA, α-aminoadipic acid; AOH, acute ocular hypertension; IOP, intraocular pressure; RGC, retinal ganglion cells, TNF-α, tumor necrosis factor-α.
Abbreviations: AAA, α-aminoadipic acid; AOH, acute ocular hypertension; IOP, intraocular pressure; RGC, retinal ganglion cells, TNF-α, tumor necrosis factor-α.
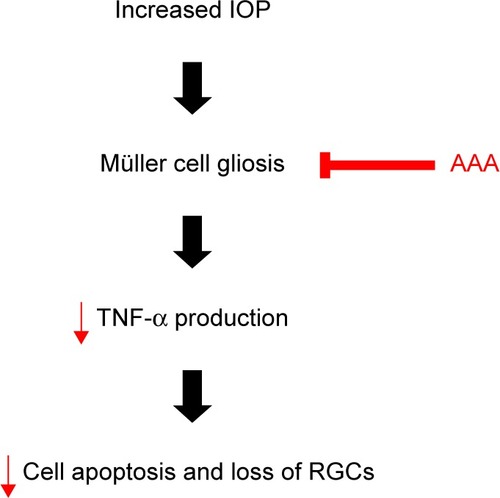
Figure S1 (A) Reprehensive results of Hoechst staining in rat retina after 1 d, 3 d, and 5 d of AOH; (B) Quantitative analysis of the retinal thickness.
Notes: The results showed that the thickness of IPL and INL layers decreased significantly following the reperfusion time after AOH treatment (scale bar =50 μm). *P<0.05 compared with the control group (n=4 per group).
Abbreviations: AOH, acute ocular hypertension; IPL, inner plexiform layer; INL, inner nuclear layer; Ctrl, control; d, day; GCL, ganglion cell layer; ONL, outer nuclear layer.
Abbreviations: AOH, acute ocular hypertension; IPL, inner plexiform layer; INL, inner nuclear layer; Ctrl, control; d, day; GCL, ganglion cell layer; ONL, outer nuclear layer.
Figure S2 Immunohistochemistry costained with antibodies against GS (green) and GFAP (red).
Note: Strong expression of GFAP was shown in the GS-positive Müller cell after 5 d of AOH compared with the control group (scale bar =50 μm).
Abbreviations: GS, glutamine synthetase; GFAP, glial fibrillary acidic protein; AOH, acute ocular hypertension; Ctrl, control; GCL, ganglion cell layer; IPL, inner plexiform layer; INL, inner nuclear layer; ONL, outer nuclear layer; d, days.
Abbreviations: GS, glutamine synthetase; GFAP, glial fibrillary acidic protein; AOH, acute ocular hypertension; Ctrl, control; GCL, ganglion cell layer; IPL, inner plexiform layer; INL, inner nuclear layer; ONL, outer nuclear layer; d, days.
Figure S3 Increased GFAP immunoreactivity after AOH induction in rat retinas.
Notes: (A) Immunofluorescent staining showed that AOH increased GFAP immunoreactivity in the Müller cell processes across IPL. Scale bar =50 μm. (B). Quantitative analysis of fluorescence intensity of GFAP (n=4 per group). *P<0.05 compared with the control group.
Abbreviations: GFAP, glial fibrillary acidic protein; AOH, acute ocular hypertension; IPL, inner plexiform layer; d, day; PBS, phosphate-buffered saline; AAA, α-aminoadipic acid.
Abbreviations: GFAP, glial fibrillary acidic protein; AOH, acute ocular hypertension; IPL, inner plexiform layer; d, day; PBS, phosphate-buffered saline; AAA, α-aminoadipic acid.