
Figures & data
Table 1 Patient and tumor characteristics
Table 2 Response among patients with locally advanced ESCC to first-line treatment
Table 3 Efficacy of first-line treatment
Table 4 Cox proportional hazard model for progression-free survival and overall survival
Figure 1 Kaplan–Meier estimates of progression-free survival according to different chemotherapy regimens.
Notes: Kaplan–Meier analysis showed that locally advanced esophageal squamous cell carcinoma patients on cisplatinum/paclitaxel regimen had longer progression-free survival than patients with cisplatinum/5-fluorouracil regimen (15.9 versus 13.0 months, P=0.016).
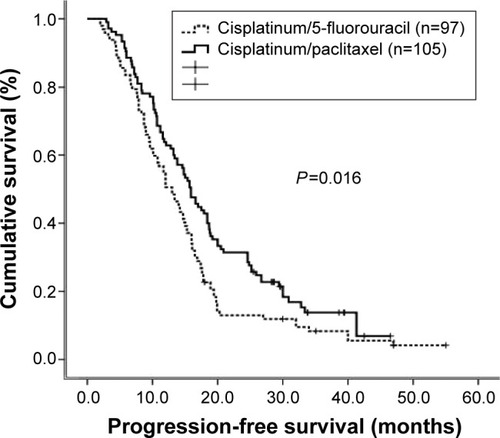
Figure 2 Kaplan–Meier estimates of overall survival according to different chemotherapy regimens.
Notes: Kaplan–Meier analysis showed that locally advanced esophageal squamous cell carcinoma patients on cisplatinum/paclitaxel regimen had longer overall survival than patients with cisplatinum/5-fluorouracil regimen (33.9 versus 23.1 months, P=0.014).
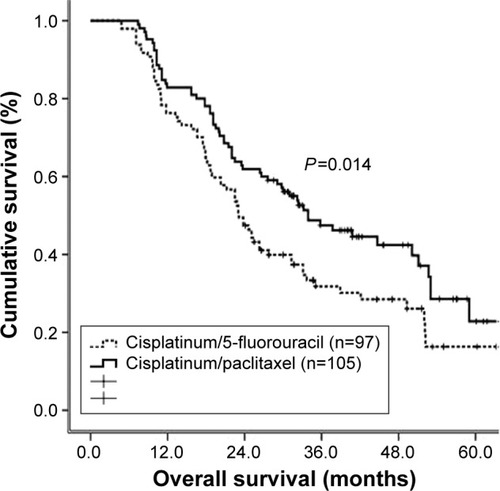
Figure 3 The ROC analysis of radiation dose.
Note: The optimal cutoff value for radiation dose is 59.5 Gy with 71.1% sensitivity and 41.9% specificity.
Abbreviations: AUC, area under the curve; ROC, receiver operating curve.
Abbreviations: AUC, area under the curve; ROC, receiver operating curve.
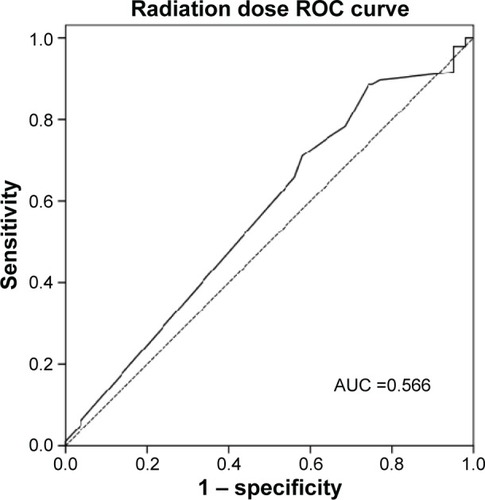
Table 5 Major toxicities during dCRT