Figures & data
Table 1 Baseline characteristics of included studies for meta-analysis
Figure 1 Eligibility of studies for inclusion in the meta-analysis.
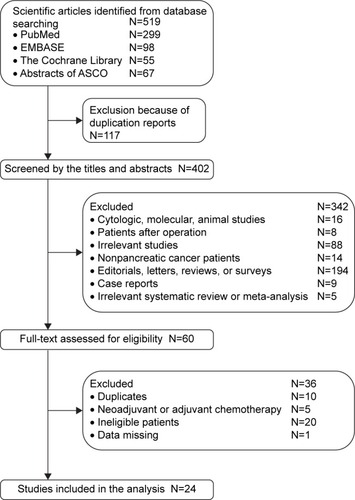
Table 2 Results of subgroup analysis for ORR and DCR
Figure 2 Forest plot of meta-analysis on ORR.
Notes: aExcluded three patients with immeasurable lesions from 15 patients; bexcluded 42 patients with immeasurable lesions from 106 patients. The gray squares indicate the ORR of each study; the red square indicates the pooled overall ORR of all the studies; the transverse line indicates the 95% CI.
Abbreviations: CI, confidence interval; ORR, objective response rate.
Abbreviations: CI, confidence interval; ORR, objective response rate.
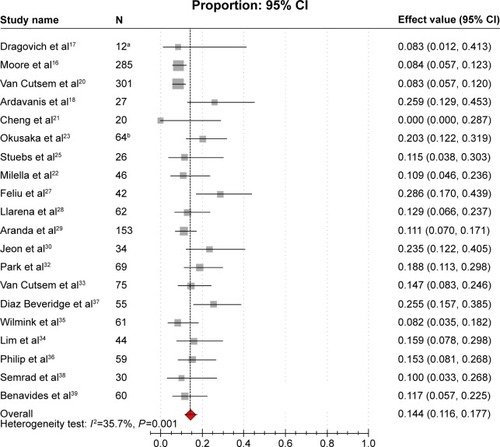
Figure 3 Forest plot of meta-analysis on DCR.
Notes: aExcluded three patients with immeasurable lesions from 15 patients; bexcluded 42 patients with immeasurable lesions from 106 patients. The gray squares indicate the DCR of each study; the red square indicates the pooled overall DCR of all the studies; the transverse line indicates the 95% CI.
Abbreviations: CI, confidence interval; DCR, disease control rate.
Abbreviations: CI, confidence interval; DCR, disease control rate.
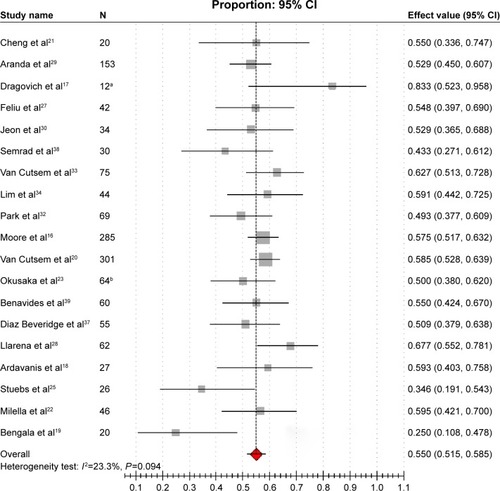
Figure 4 Forest plot of meta-analysis on 1-year survival rate.
Notes: The gray squares indicate the 1-year survival rate of each study; the red square indicates the pooled overall 1-year survival rate of all the studies; the transverse line indicates the 95% CI.
Abbreviation: CI, confidence interval.
Abbreviation: CI, confidence interval.
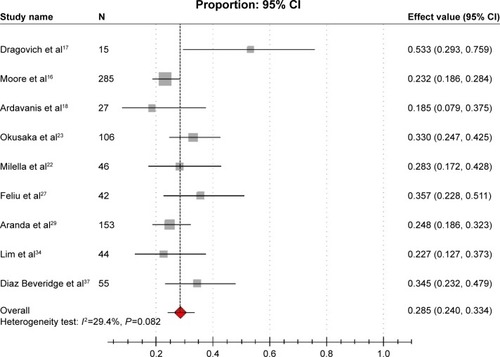
Table 3 AEs on GemErlo treatment for advanced pancreatic cancer
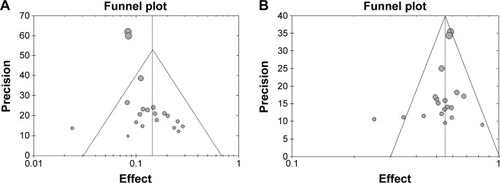
Figure 5 (A) Funnel plot of meta-analysis on ORR. (B) Funnel plot of meta-analysis on DCR.
Abbreviations: ORR, objective response rate; DCR, disease control rate.