Figures & data
Figure 1 Schematic representation of I/R injury and PKC-mediated preconditioning protocol.
Abbreviations: I/R, ischemia/reperfusion; PKC, protein kinase C; SGLT1, sodium glucose transporter 1; PMA, phorbol 12-myristate 13-acetate; PZ, phlorizin.
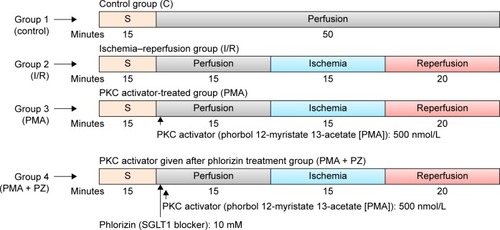
Figure 2 PKC activity correlates with increased glucose uptake through SGLT1.
Notes: (A) In vitro PKC activity in SGLT1 overexpressed H9C2 cells (H9C2-SGLT1). (B) 2-NBDG glucose uptake in SGLT1-transfected H9C2 cells. (C) 2-NBDG glucose uptake inhibition after PZ treatment. (D) PKC activity in ex vivo rat heart after IPC and PMA treatment. (E) PKC activity in mouse heart in vivo. (F) Glucose uptake in mouse heart. *P<0.05, ***P<0.001 vs control, H9C2 group and H9C2-SGLT1; ^^P<0.01, ^^^P<0.001 vs IPC, H9C2-SGLT1, PMA, H9C2-PMA, H9C2-SGLT1 + PMA group.
Abbreviations: PKC, protein kinase C; SGLT1, sodium glucose transporter 1; PMA, phorbol 12-myristate 13-acetate; PZ, phlorizin; IPC, ischemic preconditioning.
Abbreviations: PKC, protein kinase C; SGLT1, sodium glucose transporter 1; PMA, phorbol 12-myristate 13-acetate; PZ, phlorizin; IPC, ischemic preconditioning.
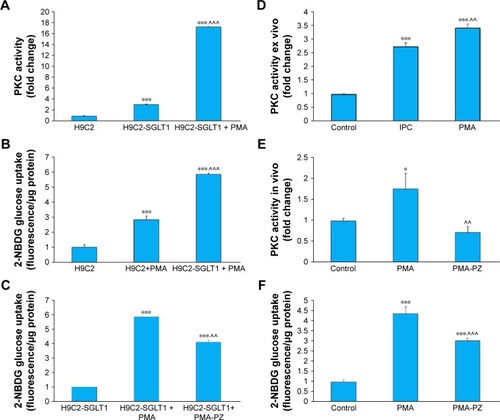
Figure 3 SGLT1 inhibition in the presence of PKC activator diminished the preconditioning effect of PKC.
Notes: (A) Catalase activity. (B) SOD activity. (C) Glutathione levels. (D) Vitamin C levels. *P<0.05, **P<0.01, ***P<0.001 vs control group; ^P<0.05, ^^P<0.01, ^^^P<0.001 vs I/R group; #P<0.05, ##P<0.01, ###P<0.001 vs PMA group.
Abbreviations: PZ, phlorizin; PKC, protein kinase C; SGLT1, sodium glucose transporter 1; PMA, phorbol 12-myristate 13-acetate; SOD, superoxide dismutase; I/R, ischemia–reperfusion.
Abbreviations: PZ, phlorizin; PKC, protein kinase C; SGLT1, sodium glucose transporter 1; PMA, phorbol 12-myristate 13-acetate; SOD, superoxide dismutase; I/R, ischemia–reperfusion.
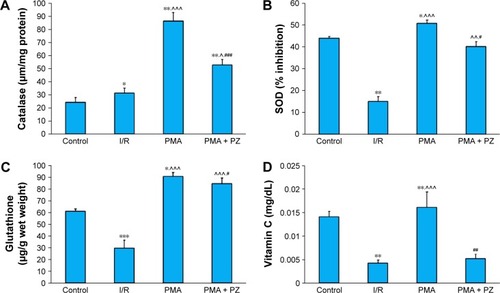
Figure 4 SGLT1 inhibition in the presence of PKC activator diminishes the preconditioning effect of PKC.
Notes: (A) TBARS levels. (B) Conjugated dienes levels. (C) DPPH levels. **P<0.01, ***P<0.001 vs control group; ^P<0.05, ^^^P<0.001 vs I/R group; #P<0.05, ###P<0.001 vs PMA group.
Abbreviations: PZ, phlorizin; PKC, protein kinase C; SGLT1, sodium glucose transporter 1; PMA, phorbol 12-myristate 13-acetate; TBARS, thiobarbituric acid reactive substances; DPPH, di(phenyl)-(2,4,6-trinitrophenyl)iminoazanium; I/R, ischemia–reperfusion.
Abbreviations: PZ, phlorizin; PKC, protein kinase C; SGLT1, sodium glucose transporter 1; PMA, phorbol 12-myristate 13-acetate; TBARS, thiobarbituric acid reactive substances; DPPH, di(phenyl)-(2,4,6-trinitrophenyl)iminoazanium; I/R, ischemia–reperfusion.
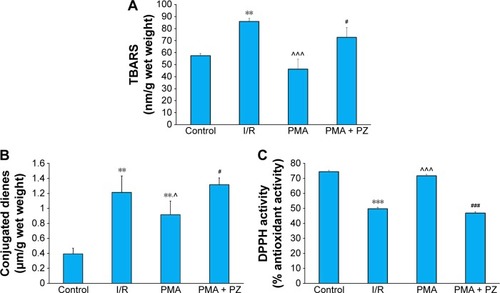
Figure 5 SGLT1 inhibition in the presence of PKC activator induces apoptosis and myocardial injury.
Notes: (A) Caspase-3 activity. (B) TUNEL staining (20×). (C) Histopathology of rat heart after H&E staining (20×). **P<0.01, ***P<0.001 vs control group; ^P<0.05, ^^^P<0.001 vs I/R group; #P<0.05, vs PMA group.
Abbreviations: PZ, phlorizin; PKC, protein kinase C; SGLT1, sodium glucose transporter 1; PMA, phorbol 12-myristate 13-acetate; TUNEL, terminal deoxynucleotidyl transferase dUTP nick end labeling; I/R, ischemia–reperfusion; H&E, hematoxylin and eosin.
Abbreviations: PZ, phlorizin; PKC, protein kinase C; SGLT1, sodium glucose transporter 1; PMA, phorbol 12-myristate 13-acetate; TUNEL, terminal deoxynucleotidyl transferase dUTP nick end labeling; I/R, ischemia–reperfusion; H&E, hematoxylin and eosin.
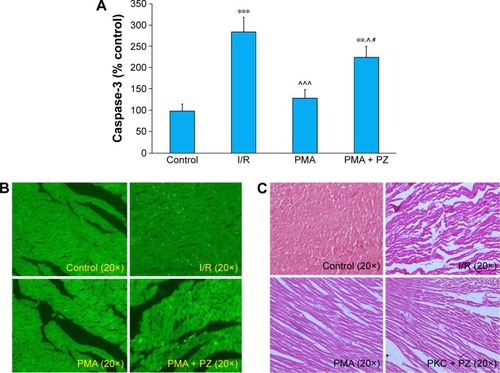
Figure 6 Protein–protein docking.
Notes: (A) Structural fluctuation from MD simulation of modeled proteins as described in terms of RMSD as a function of time for PKC (in purple) and SGLT1 (in red). (B) Docking energy: X-axis-conformers, Y-axis-energy in kcal/mol. (C) Histogram of docking energy.
Abbreviations: MD, molecular dynamics; RMSD, root-mean square deviation; PKC, protein kinase C; SGLT1, sodium glucose transporter 1.
Abbreviations: MD, molecular dynamics; RMSD, root-mean square deviation; PKC, protein kinase C; SGLT1, sodium glucose transporter 1.
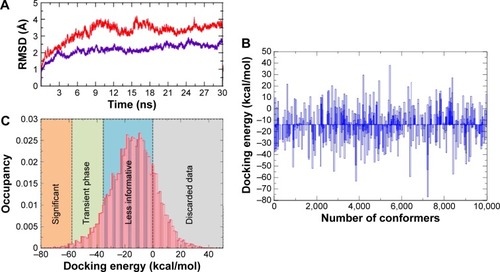
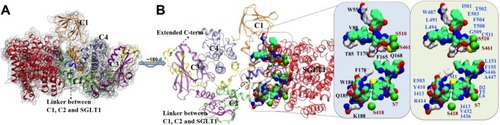
Figure 7 Structural visualization of PKC-SGLT1 docked complex.
Notes: (A) Domain-wise rendering of PKC, C1: orange, C2: lime, C3: purple, C4: ice-blue; and extended C-terminal: yellow; while SGLT1: red. The linker part is in blue. (B) About 180° flipped from panel A (with same set up as A). The atom-wise VdW surface rendering of interface residues as C: green (SGLT1) and white (PKC); O: red; N: blue; and S: yellow. The inset view is showing the interacting PKC and SGLT1 residues, separately.
Abbreviations: SGLT1, sodium glucose transporter 1; PKC, protein kinase C.
Abbreviations: SGLT1, sodium glucose transporter 1; PKC, protein kinase C.