Figures & data
Figure 1 Salivary flow and AMS activity exam.
Notes: Saliva flow in a preclinical murine model of radiation-induced hyposalivation (A). Saliva was collected for 15 minutes after pilocarpine stimulation at 8 hours, 24 hours, and 4 weeks after 15 Gy irradiation and then normalized to body weight measured before collection (n=8). Saliva flow of Group III (irradiation + solvent) presented with time-dependent decrease. While saliva flow of Group IV (irradiation + SIM) was not altered until 24 hours after IR, the extent of decrease was less than that of Group III at the other two time intervals. AMS activity of the four groups at different time intervals (B). AMS activity decreased only at 4 weeks after IR in IR-only group, while it increased significantly in the combination group at this time point. **P<0.01, compared with the respective solvent group; #P<0.05, ##P<0.01, compared with Group IV.
Abbreviations: IR, irradiation; AMS, amylase; h, hours; w, weeks.
Abbreviations: IR, irradiation; AMS, amylase; h, hours; w, weeks.
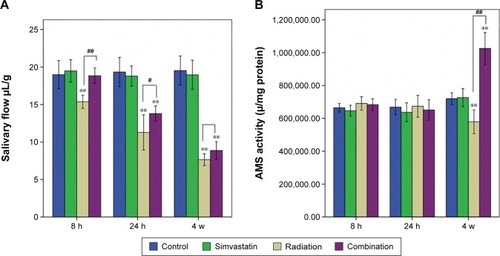
Figure 2 Serum cholesterol and MDA content in SMGs of the four groups at different time intervals.
Notes: The total serum cholesterol of SIM-treated groups showed a decreasing tendency with time. Serum cholesterol of the irradiated groups showed a slight but not significant increase compared to the respective control groups (). Electron-ray radiation induced a significant increase of MDA content in SMG in Groups III (irradiation + solvent) and IV (irradiation + SIM) when compared to Group I (solvent + sham irradiation) at all three time intervals (P<0.01, ). The extent of the increment in Group IV was less pronounced than that in Group III at 8 hours and 24 hours and returned to control levels by 4 weeks after IR. Each group consisted of six samples. **P<0.01, compared with the respective solvent group; ##P<0.01, compared with Group IV.
Abbreviations: MDA, malondialdehyde; SMG, submandibular gland; d, days; h, hours; w, weeks.
Abbreviations: MDA, malondialdehyde; SMG, submandibular gland; d, days; h, hours; w, weeks.
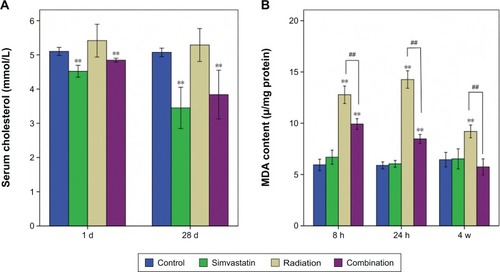
Figure 3 Histopathological changes in SMGs after irradiation (H&E staining).
Notes: (A and B) Normal appearances of SMG in nonirradiated mice (A: Group I solvent + sham irradiation; B: Group II SIM + sham irradiation). (C–E) Histopathological changes in SMG of Group III (irradiation + solvent) at 8 hours, 24 hours, and 4 weeks separately after IR. (F–H) Histopathological changes in SMG of Group IV (irradiation + SIM) at the three time points. At 8 hours (C) and 24 hours (D), vacuolization of acinar cells and some pyknotic and polymorphic nuclei could be observed. At 4 weeks after IR (E), some inflammatory cells infiltration and focal fibrosis presented. Group IV showed clearer lobular structures, fewer vacuoles and inflammatory infiltration, and less fibration (F, G, H). *, vacuolization; →, inflammatory cells infiltration; *, fibrosis. Original magnification, ×400.
Abbreviations: SMG, submandibular gland; H&E, hematoxylin and eosin; IR, irradiation; SD, striated duct; bv, blood vessel; Ser, seromucous acinus.
Abbreviations: SMG, submandibular gland; H&E, hematoxylin and eosin; IR, irradiation; SD, striated duct; bv, blood vessel; Ser, seromucous acinus.
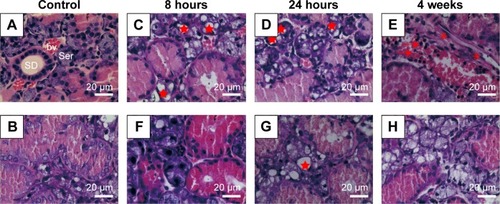
Figure 4 Masson’s trichrome staining; collagen stained blue.
Notes: A small amount of collagen was seen in Group I (solvent + sham irradiation) (A) and Group II (SIM + sham irradiation) (B), while a large amount of collagen in Group III (irradiation + solvent) at 4 weeks after IR (C), but less than that in Group IV (irradiation + SIM) (D) could be observed (green arrows).
Abbreviation: IR, irradiation.
Abbreviation: IR, irradiation.
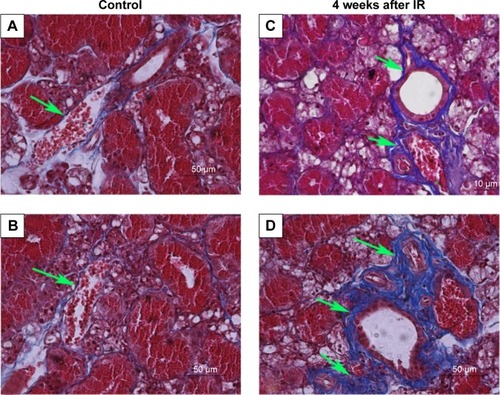
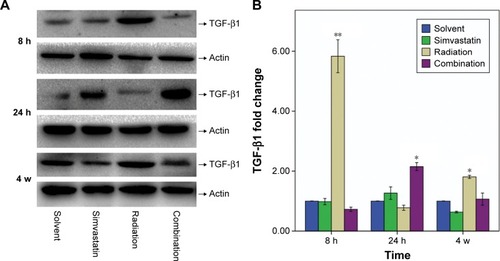
Figure 5 Protein content of TGF-β1 (25 Kd) in SMGs of mice at 8 hours, 24 hours, and 4 weeks after IR was assessed by Western blot analysis.
Notes: (A) Representative Western blots from three to five experiments with similar results. (B) Changes in TGF-β1 quantified by scanning densitometry analysis using Image Lab software. The data (relative density normalized to β-actin) are expressed as mean ± SD; *P<0.05, **P<0.01.
Abbreviations: TGF-β1, transforming growth factor β1; SMG, submandibular gland; IR, irradiation; SD, standard deviation; h, hours; w, weeks.
Abbreviations: TGF-β1, transforming growth factor β1; SMG, submandibular gland; IR, irradiation; SD, standard deviation; h, hours; w, weeks.