Figures & data
Figure 1 Effects of EPO on plasma glucose levels in type 1-like diabetic rats.
Notes: Dose-dependent changes in plasma glucose induced by EPO in rats with streptozotocin-induced diabetes are shown. Values (mean ± SE) were obtained from groups of eight animals. *P<0.05 and **P<0.01 compared with the vehicle-treated diabetic rats.
Abbreviations: EPO, erythropoietin; SE, standard error.
Abbreviations: EPO, erythropoietin; SE, standard error.
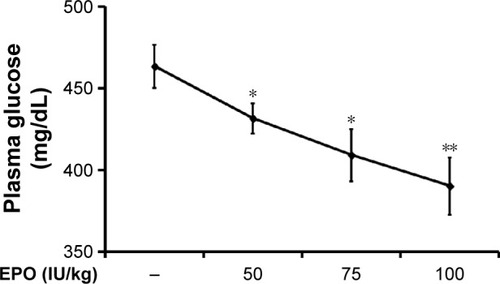
Figure 2 Blockade of EPO-induced actions by antibodies specific to EPORs in type 1-like diabetic rats.
Notes: EPO-induced reduction of plasma glucose (middle column) reversed by antibodies specific to EPORs (right column) in rats with streptozotocin-induced diabetes. Values (mean ± SE) were obtained from groups of eight animals. *P<0.05 compared with the vehicle-treated diabetic rats.
Abbreviations: EPO, erythropoietin; EPOR, erythropoietin receptor; SE, standard error.
Abbreviations: EPO, erythropoietin; EPOR, erythropoietin receptor; SE, standard error.
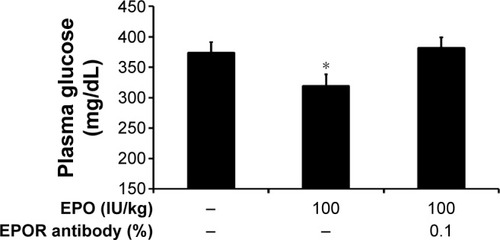
Figure 3 EPO-induced changes in blood glucose in rats measured using an IVGTT.
Notes: EPO-induced changes in blood glucose in normal rats that received an intravenous injection of glucose compared with that for same volume of vehicle are shown in (A). IVGTT was performed, and the calculated AUC values are compared in (B). Values (mean ± SE) were obtained from groups of eight animals. *P<0.05 compared with the vehicle-treated group.
Abbreviations: AUC, area under the curve; EPO, erythropoietin; IVGTT, intravenous glucose tolerance test; SE, standard error.
Abbreviations: AUC, area under the curve; EPO, erythropoietin; IVGTT, intravenous glucose tolerance test; SE, standard error.
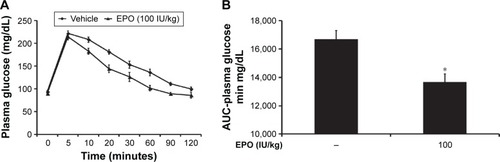
Figure 4 EPO-induced changes in insulin sensitivity in diabetic rats.
Notes: Blood glucose data from the diabetes model receiving vehicle treatment are shown as “Vehicle”, and those from the EPO-treated diabetic rats are shown as “EPO” with the indicated dose. Values (mean ± SE) were obtained from groups of eight animals. *P<0.05 compared with the vehicle-treated diabetic rats.
Abbreviations: EPO, erythropoietin; SE, standard error.
Abbreviations: EPO, erythropoietin; SE, standard error.
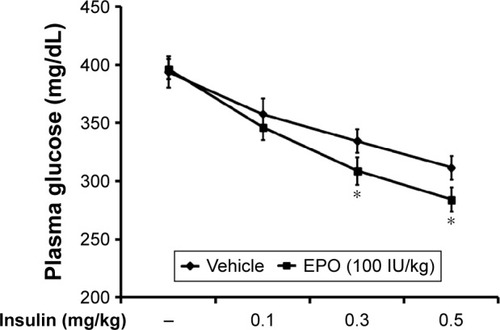
Figure 5 EPO-induced changes in GLUT4 expression (A) and AMPK phosphorylation (B) in the soleus muscle of type 1-like diabetic rats.
Notes: Changes in GLUT4 expression (A) or phosphorylated AMPK (p-AMPK) (B) in rats with STZ-induced diabetes are shown as “STZ” for comparison with the changes in normal rats, “Normal”. In addition, the EPO effects on diabetic rats are shown as “STZ + EPO” for comparison with diabetic rats that received vehicle only (STZ + Vehicle). Representative immunoblots are shown in the upper portion, and the relative expression levels of GLUT4/actin or p-AMPK/AMPK are shown in the lower column (mean ± SE). The data were obtained from six animals. *P<0.05 and **P<0.01 compared with “Normal”.
Abbreviations: AMPK, AMP-activated protein kinase; AMP, adenosine monophosphate; EPO, erythropoietin; GLUT4, glucose transporter 4; SE, standard error; STZ, streptozotocin.
Abbreviations: AMPK, AMP-activated protein kinase; AMP, adenosine monophosphate; EPO, erythropoietin; GLUT4, glucose transporter 4; SE, standard error; STZ, streptozotocin.
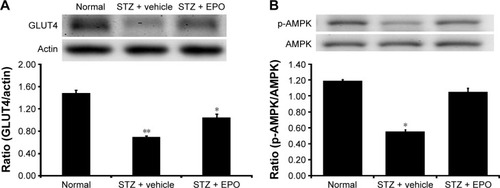
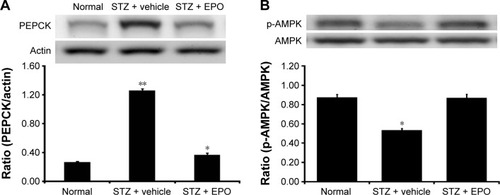
Figure 6 EPO-induced changes of PEPCK expression (A) and AMPK phosphorylation (B) in the liver of type 1-like diabetic rats.
Notes: Changes in PEPCK expression (A) or p-AMPK (B) in rats with STZ-induced diabetes are shown as “STZ” for comparison with the changes in normal rats, “Normal”. In addition, the effects of EPO on diabetic rats are shown as “STZ + EPO” with the indicated dose to compare the diabetic rats that received vehicle only (STZ + Vehicle). Representative immunoblots are shown in the upper portion, and the relative expression levels of PEPCK/actin or p-AMPK/AMPK are shown in the lower column (mean ± SE). The data were obtained from six animals. *P<0.05 and **P<0.01 compared with “Normal”.
Abbreviations: AMPK, AMP-activated protein kinase; AMP, adenosine monophosphate; EPO, erythropoietin; p-AMPK, phosphorylated AMPK; PEPCK, phosphoenolpyruvate carboxykinase; SE, standard error; STZ, streptozotocin.
Abbreviations: AMPK, AMP-activated protein kinase; AMP, adenosine monophosphate; EPO, erythropoietin; p-AMPK, phosphorylated AMPK; PEPCK, phosphoenolpyruvate carboxykinase; SE, standard error; STZ, streptozotocin.