Figures & data
Table 1 Demographic and baseline characteristics of the study population
Figure 1 Flowchart of patient disposition throughout the study.
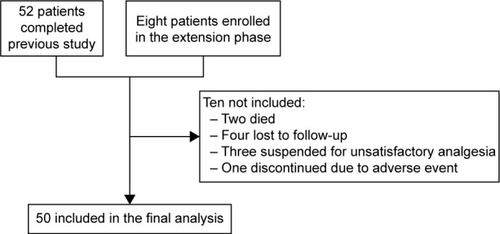
Table 2 Pain intensity (NRS score) during the 52 weeks of oxycodone/naloxone prolonged-release treatment
Figure 2 Distribution of OXN-PR daily dosages throughout the observation (expressed in oxycodone equivalents).
Abbreviation: OXN-PR, prolonged-release oxycodone–naloxone.
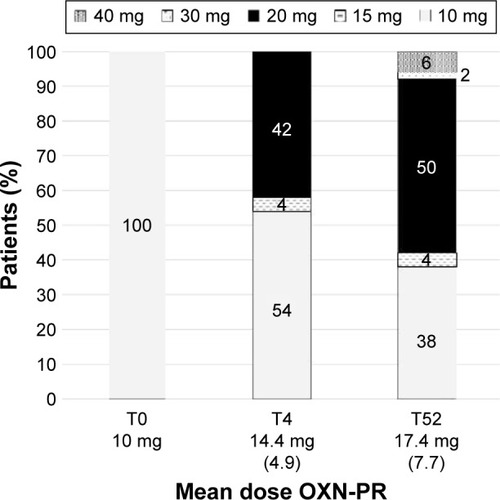
Figure 3 Value of secondary outcomes (BPI, MMSE, and Barthel Index) at different time points of the observations.
Abbreviations: BPI, Brief Pain Inventory; MMSE, Mini-Mental State Examination.
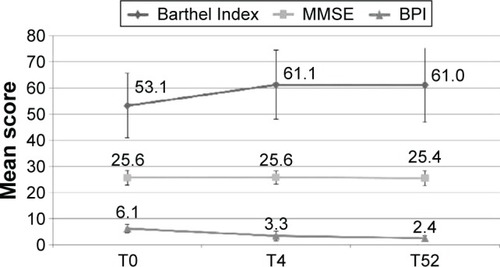
Figure 4 Value of Bowel Function Index at different time points of the observations.
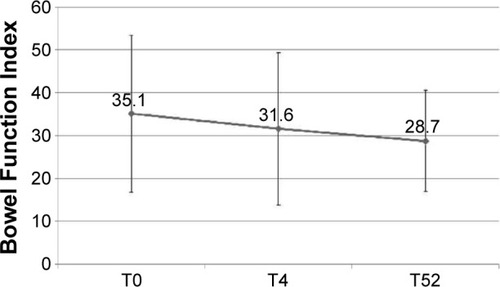
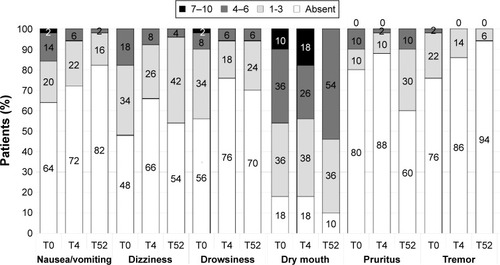
Figure 5 Prevalence and severity of commonly observed opioid-related side effects and tremor at the different points of the observation.
Notes: Symptom severity rated on an 11-point scale (0= absent; 1–3= mild; 4–6= moderate; 7–10= severe).