Figures & data
Figure 1 Transcriptomics and genetic alteration analyses of cytoskeleton regulators.
Notes: (A) Transcriptomics data shown as a color code, representing fold change in expression of 85 cytoskeletal regulators grouped into ten groups with abbreviated subgroups, in tumor tissue compared to corresponding organ-specific controls. The majority of the genes analyzed exhibited differential gene expression in favor of the tumor tissue. (B) Quantification of total genetic alterations in these 85 genes grouped into ten groups with abbreviated subgroups, obtained by querying 291 patient samples from the TCGA data set. Each gene is shown by a horizontal bar graph with their percentage of genetic alteration shown on the x-axis. (C) Summary of 14 genes with high genetic alteration. Each column represents a unique patient sample.
Abbreviations: TCGA, The Cancer Genome Atlas; IP, interacting proteins; OR, organizing and biogenesis; P-D, polymerization or depolymerization; CC, cortical cytoskeleton; SP, spindle organization and biogenesis; AX, axon and dendrites formation; FL, filopodia; G, growth cones; LAM, lamellipodia; MV, microvilli; P, pseudopodia; RF, ruffles; CS-S-P, cell shape–size–polarity; CMM, cell motility or migration; M, mitosis; CK, cytokinesis; CA, cytoskeleton adaptors; Cal, calmodulins and calcineurins; G-Prot, G-protein signaling; Kin&Pho, kinases and phosphatases.
Abbreviations: TCGA, The Cancer Genome Atlas; IP, interacting proteins; OR, organizing and biogenesis; P-D, polymerization or depolymerization; CC, cortical cytoskeleton; SP, spindle organization and biogenesis; AX, axon and dendrites formation; FL, filopodia; G, growth cones; LAM, lamellipodia; MV, microvilli; P, pseudopodia; RF, ruffles; CS-S-P, cell shape–size–polarity; CMM, cell motility or migration; M, mitosis; CK, cytokinesis; CA, cytoskeleton adaptors; Cal, calmodulins and calcineurins; G-Prot, G-protein signaling; Kin&Pho, kinases and phosphatases.
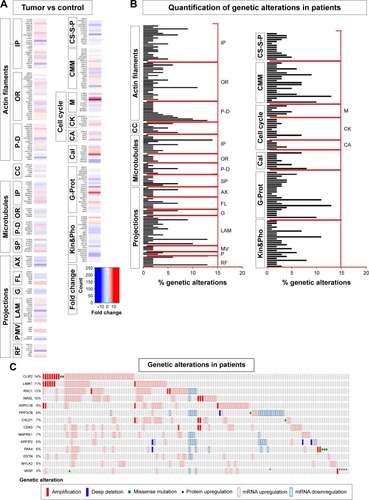
Figure 2 Transcriptomics data shown as a color code representing fold change in expression of 85 genes grouped into ten groups with abbreviated subgroups, in GBM samples compared to neural stem cells (NSCs).
Notes: The column “Total” represents GBM versus NSCs regardless of their CD133 expression status. The “CD133+” column compares only the CD133+ fraction of the GBM with the CD133+ fraction of NSCs. Similarly, the “CD133−” column compares the CD133− fraction of the GBM with the CD133− fraction of NSCs.
Abbreviations: GBM, glioblastoma multiforme; IP, interacting proteins; OR, organizing and biogenesis; P-D, polymerization or depolymerization; CC, cortical cytoskeleton; SP, spindle organization and biogenesis; AX, axon and dendrites formation; FL, filopodia; G, growth cones; LAM, lamellipodia; MV, microvilli; P, pseudopodia; RF, ruffles; CS-S-P, cell shape–size–polarity; CMM, cell motility or migration; M, mitosis; CK, cytokinesis; CA, cytoskeleton adaptors; Cal, calmodulins and calcineurins; G-Prot, G-protein signaling; Kin&Pho, kinases and phosphatases.
Abbreviations: GBM, glioblastoma multiforme; IP, interacting proteins; OR, organizing and biogenesis; P-D, polymerization or depolymerization; CC, cortical cytoskeleton; SP, spindle organization and biogenesis; AX, axon and dendrites formation; FL, filopodia; G, growth cones; LAM, lamellipodia; MV, microvilli; P, pseudopodia; RF, ruffles; CS-S-P, cell shape–size–polarity; CMM, cell motility or migration; M, mitosis; CK, cytokinesis; CA, cytoskeleton adaptors; Cal, calmodulins and calcineurins; G-Prot, G-protein signaling; Kin&Pho, kinases and phosphatases.
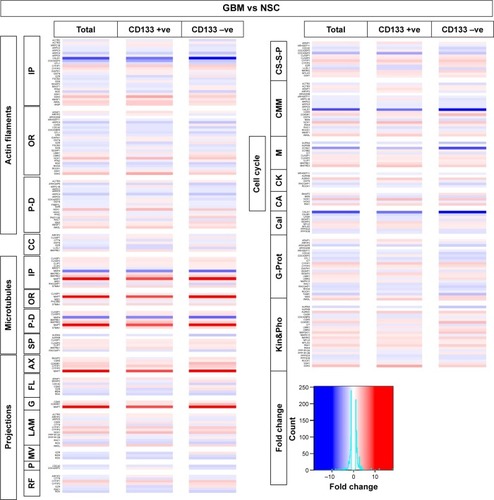
Figure 3 Transcriptomics and patient survival plots of cytoskeletal regulators.
Notes: (A) Heat map displaying fold change in gene expression for the genes grouped as ten groups with abbreviated subgroups and analyzed between GBM stem-like cells and GBM cells subject to differentiation. (B) Patient survival plots of 12 genes with high statistical significance based on high or low expression of the genes.
Abbreviations: GBM, glioblastoma multiforme; IP, interacting proteins; OR, organizing and biogenesis; P-D, polymerization or depolymerization; CC, cortical cytoskeleton; SP, spindle organization and biogenesis; AX, axon and dendrites formation; FL, filopodia; G, growth cones; LAM, lamellipodia; MV, microvilli; P, pseudopodia; RF, ruffles; CS-S-P, cell shape–size–polarity; CMM, cell motility or migration; M, mitosis; CK, cytokinesis; CA, cytoskeleton adaptors; Cal, calmodulins and calcineurins; G-Prot, G-protein signaling; Kin&Pho, kinases and phosphatases.
Abbreviations: GBM, glioblastoma multiforme; IP, interacting proteins; OR, organizing and biogenesis; P-D, polymerization or depolymerization; CC, cortical cytoskeleton; SP, spindle organization and biogenesis; AX, axon and dendrites formation; FL, filopodia; G, growth cones; LAM, lamellipodia; MV, microvilli; P, pseudopodia; RF, ruffles; CS-S-P, cell shape–size–polarity; CMM, cell motility or migration; M, mitosis; CK, cytokinesis; CA, cytoskeleton adaptors; Cal, calmodulins and calcineurins; G-Prot, G-protein signaling; Kin&Pho, kinases and phosphatases.
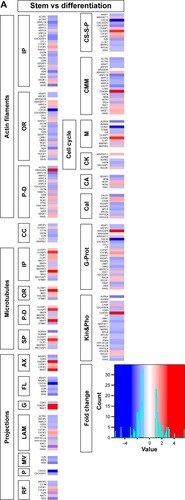
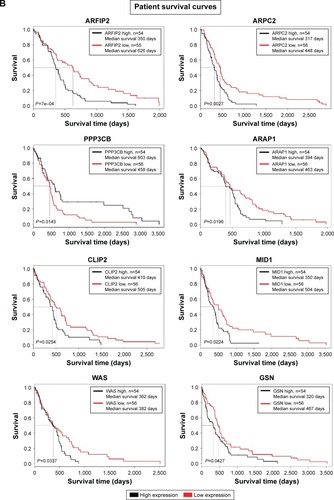
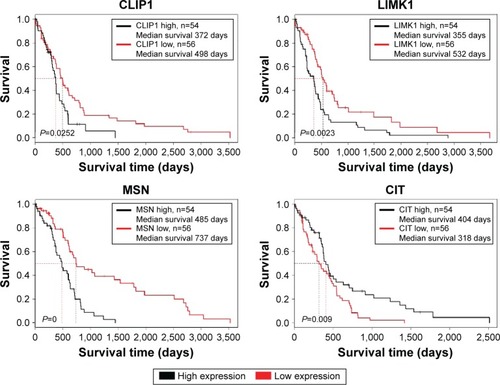
Figure 4 Cell viability screen using FDA approved oncology drugs.
Notes: (A) Viability scatter plot of all the FDA-approved oncology drugs when compared to DMSO (baseline) in red and temozolomide (shown as black square). (B) Pie chart representation of all the FDA-approved drugs tested in this study. (C) Percentage of toxicity shown by different classes of drugs, with alkylating, antitumor antibiotics, antimetabolite, kinase inhibitors, others, mitotic inhibitors, and topoisomerase inhibitors abbreviated as A, AA, AM, KI, O, MI, and TI, respectively. (D–J) Viability score of each drug shown as a color code for each class of compounds tested.
Abbreviation: DMSO, dimethyl sulfoxide.
Abbreviation: DMSO, dimethyl sulfoxide.
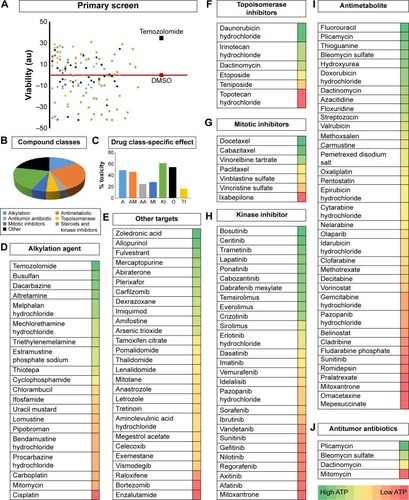
Figure 5 Cell viability analyses of temozolomide and other compounds.
Notes: (A) Log dilution series, in molar concentrations (M) of temozolomide (TMZ) and its effect on cell viability measured at day 4. The IC50 values are represented as an inset in the graph. (B) Cell viability measurement of small molecules producing the highest effect on GBM cells after 4 days of treatment at 10 μM final concentration. Error bars are represented as standard deviation. (A) Log dilution series, in molar concentrations (M) of temozolomide (TMZ).
Abbreviations: IC50, half maximal inhibitory concentration; GBM, glioblastoma multiforme; DMSO, dimethyl sulfoxide.
Abbreviations: IC50, half maximal inhibitory concentration; GBM, glioblastoma multiforme; DMSO, dimethyl sulfoxide.
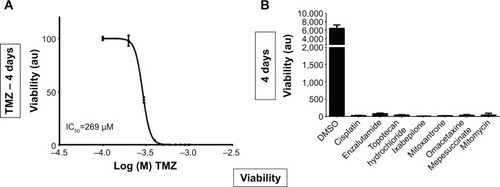
Figure 6 Staining of GBM cells with DAPI, phalloidin, and antiacetylated tubulin antibody after 2 days treatment with DMSO or different compounds.
Note: Compound treatment effect on cell viability is also shown by bar graphs placed at the end of each image panel series. Data are mean ± SD.
Abbreviations: GBM, glioblastoma multiforme; DAPI, 4′,6-diamidino-2-phenylindole; DMSO, dimethyl sulfoxide; Ac, antiacetylated.
Abbreviations: GBM, glioblastoma multiforme; DAPI, 4′,6-diamidino-2-phenylindole; DMSO, dimethyl sulfoxide; Ac, antiacetylated.
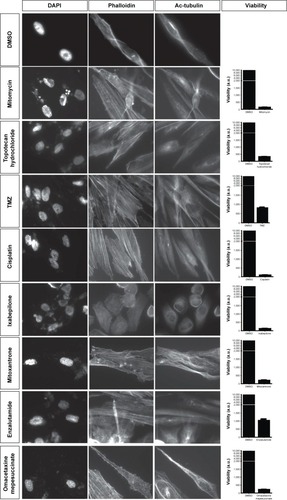
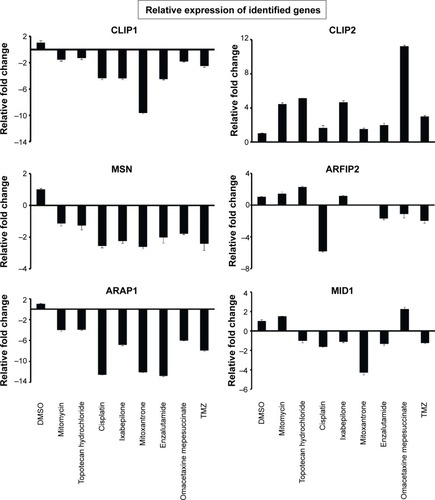
Figure 7 qPCR analyses after compound treatment.
Notes: The six genes analyzed here are grouped into two columns (CLIP1, MSN, ARAP1 and CLIP2, ARFIP2, MID1), and the names of compounds used are shown at the bottom.
Abbreviation: qPCR, quantitative polymerase chain reaction.
Abbreviation: qPCR, quantitative polymerase chain reaction.