Figures & data
Table 1 Compositions of blank SNEDDS formulations varying in oil content
Table 2 Solubility results of cyclovirobuxine D in various excipients (mean ± SD; n=3)
Table 3 Emulsification efficacy of various surfactants
Table 4 Emulsification abilities of various cosurfactants
Figure 1 Pseudo-ternary phase diagram depicting the nanoemulsion region (NE).
Abbreviations: S/Cos, surfactant/cosurfactant; Km, surfactant/cosurfactant of different mass ratios.
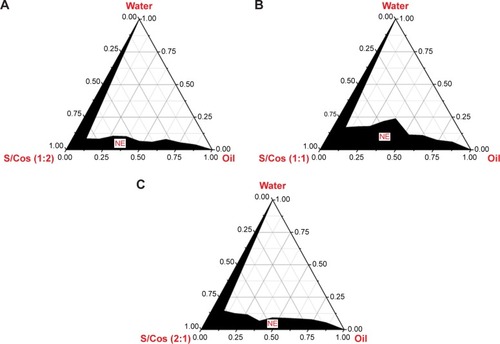
Figure 2 Effect of oil content and cyclovirobuxine D loading on globule size.
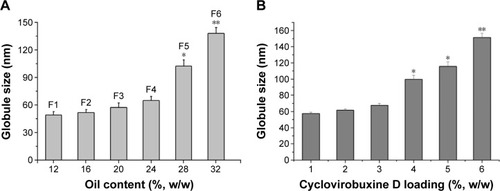
Figure 3 TEM images of the nanoemulsion in the different scale of 0.2 μm (A) and 0.05 μm (B).
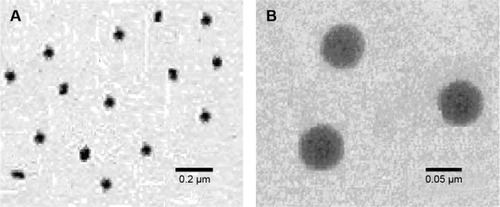
Figure 4 In vitro release profiles of SNEDDS and market tablets.
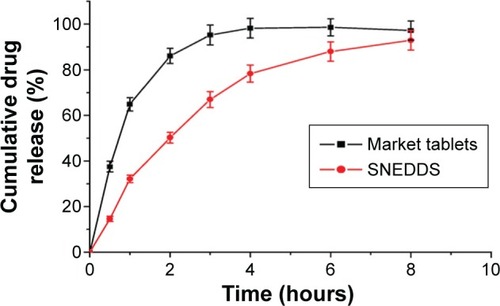
Figure 5 Transport amount of cyclovirobuxine D in 4 hours (A) and Caco-2 cell viability after transport study (B) #P>0.05 vs market tablets.
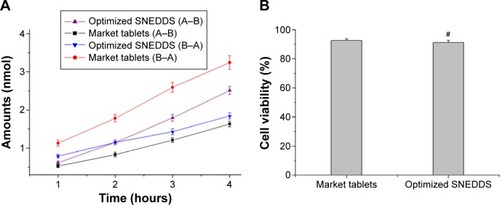
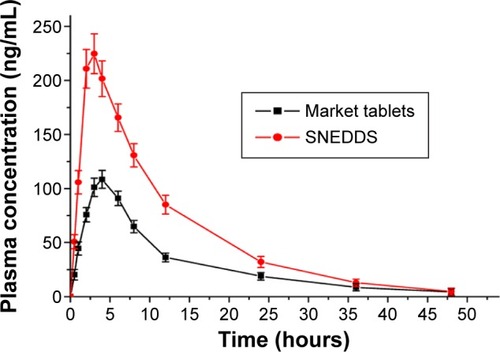
Table 5 Pharmacokinetic parameters of cyclovirobuxine D following oral administration to rabbits (mean ± SD, n=6)
Figure 6 Plasma concentrations vs time profile after oral administration of SNEDDS and market tablets (mean ± SD, n=6).