
Figures & data
Table 1 MIC (µg/mL) of Zolav® and clindamycin (control) against P. acnes
Table 2 Cytotoxicity of Zolav® and staurosporin (control) in cell lines
Table 3 Activity of Zolav® on revertant colonies of Escherichia coli in the presence of S9
Figure 1 Propionibacterium acnes CFU per gram of skin tissue in mice.
Notes: Bars = mean + SEM; n=3 for “vehicle control 2 hours (baseline)” (dashed line) and n=5 for “vehicle control – 96 hours” and “Zolav® – 96 hours 50 µg/mL (q8h)”.
Abbreviations: CFU, colony-forming unit; SEM, standard error of the mean; h, hours; q8h, every 8 hours.
Abbreviations: CFU, colony-forming unit; SEM, standard error of the mean; h, hours; q8h, every 8 hours.
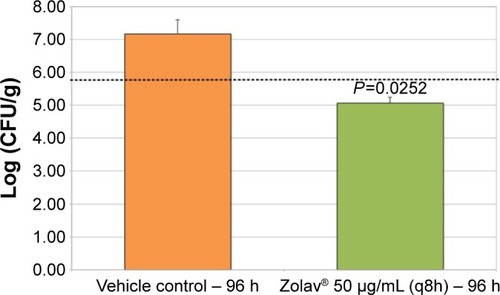
Figure S1 Comparison of infection area between treated and untreated mice.
Notes: Pictures of mice from the untreated group (A and B) and Zolav® at 50 µg/mL q8h (C and D) treated group at 26 hours (A and C) and at 50 hours (B and D) after challenge.
Table S1 Activity of Zolav® on revertant colonies of Escherichia coli in the absence of S9
Table S2 Summary of Propionibacterium acnes intradermal infection model in mice in CFU/g (log10)