
Figures & data
Table 1 Baseline characteristics of the study population
Table 2 Changes in BP and heart rate after fimasartan treatment
Table 3 Changes in BP variability SD after fimasartan treatment
Figure 1 Correlation between standard deviation (sd) of clinical systolic blood pressure (SBP) and sd of morning home SBP at baseline and after 3 months of fimasartan treatment.
Notes: (A) sd of morning home SBP versus sd of clinical SBP at baseline. (B) sd of morning home SBP versus sd of clinical SBP after fimasartan treatment. (C) sd of evening home SBP versus sd of clinical SBP at baseline. (D) sd of evening home SBP versus sd of clinical SBP after fimasartan treatment.
Abbreviations: b_SBPsd, sd of baseline SBP; m3_SBPsd, sd of clinical SBP after 3 months of fimasartan treatment; b_am_hSBPsd, sd of baseline morning home SBP; b_pm_hSBPsd, sd of baseline evening home SBP.
Abbreviations: b_SBPsd, sd of baseline SBP; m3_SBPsd, sd of clinical SBP after 3 months of fimasartan treatment; b_am_hSBPsd, sd of baseline morning home SBP; b_pm_hSBPsd, sd of baseline evening home SBP.
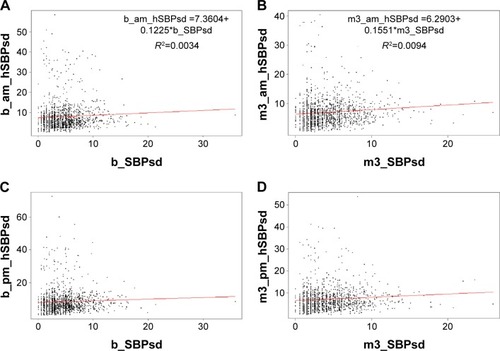
Figure 2 Changes in BPV and BP after fimasartan treatment.
Notes: (A) Changes in SD of beat-to-beat BP (BPV) in clinical and home (morning) settings after 3 months of fimasartan treatment. (B) Changes in clinical BP and home (morning) BP after 3 months of fimasartan treatment.
Abbreviations: BP, blood pressure; BPV, BP variability; c, clinical; m, morning; SBP, systolic blood pressure; SD, standard deviation.
Abbreviations: BP, blood pressure; BPV, BP variability; c, clinical; m, morning; SBP, systolic blood pressure; SD, standard deviation.
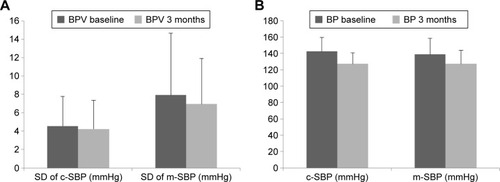
Table 4 Linear regression analyses of factors associated with SD of clinical and home SBP at baseline
Table 5 Linear regression analyses of factors associated with changes in SD of clinical and morning home SBP after fimasartan treatment