Figures & data
Table 1 Primary antibodies, clones, and dilutions for immunostaining
Figure 1 Effect of sildenafil and/or cisplatin on tumor volume.
Abbreviation: SEM, standard error of the mean.
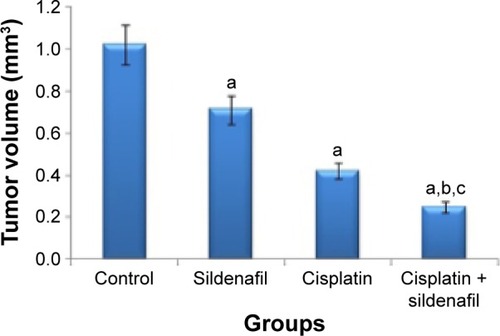
Table 2 Effect of sildenafil and/or cisplatin on angiogenin and tumor necrosis factor-alpha (TNF-α)
Table 3 Effect of sildenafil and/or cisplatin on VEGF, Ki-67, and caspase-3
Figure 2 Cytoplasmic VEGF staining in tumor sections from different groups.
Abbreviation: VEGF, vascular endothelial growth factor.
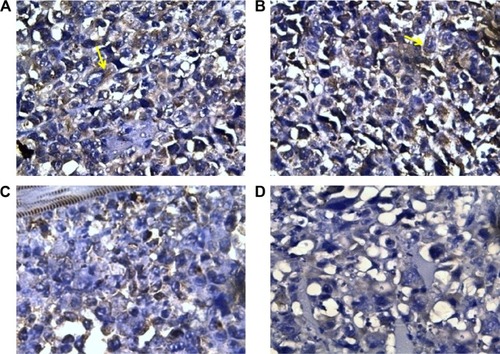
Figure 3 Ki-67 nuclear expression in different groups.
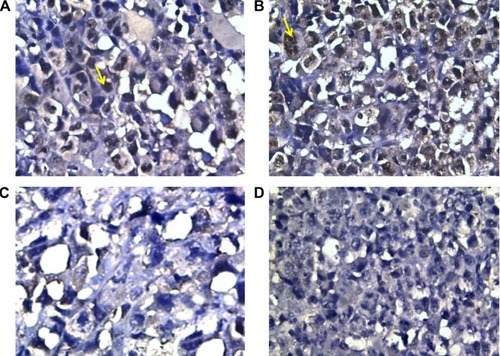
Figure 4 Caspase-3 expression in different groups of tumors.
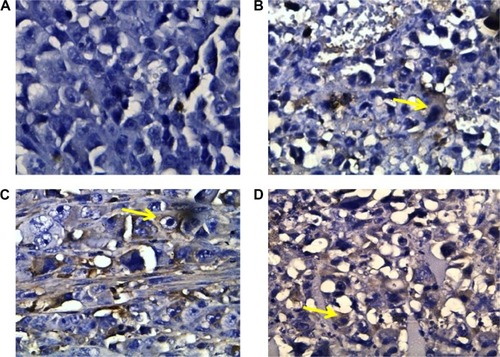
Figure 5 Histopathological examination of solid tumor.
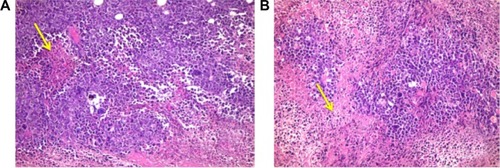
Figure 6 Effect of sildenafil and/or cisplatin on the cell cycle.
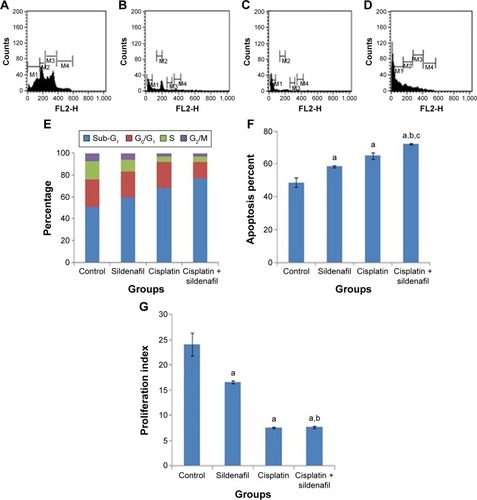
Figure 7 Cytotoxic effect of cisplatin and/or sildenafil on MCF-7 cell line.
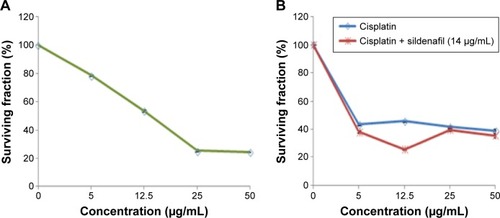
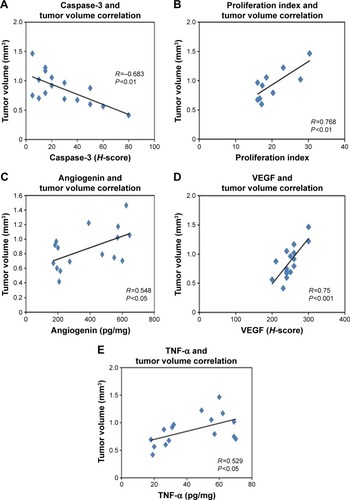
Figure 8 Scatter plots of significant correlation between tumor volume and caspase-3 (A), proliferation index (B), angiogenin (C), VEGF (D) and TNF-α (E) in sildenafil-treated group.
Abbreviations: TNF-α, tumor necrosis factor-alpha; VEGF, vascular endothelial growth factor.