
Figures & data
Figure 1 Study flow and timeline.
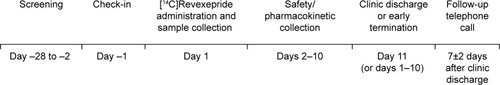
Table 1 Study demographics and participant characteristics
Table 2 Mean data for urinary and fecal 14C dose excretion
Figure 2 Mean cumulative percent of radioactive dose recovered in urine and feces following administration of a single dose of 2 mg [14C]revexepride to healthy male volunteers in the pharmacokinetic analysis set (linear scale).
Note: Error bars are presented as ± standard deviation and have been staggered.
![Figure 2 Mean cumulative percent of radioactive dose recovered in urine and feces following administration of a single dose of 2 mg [14C]revexepride to healthy male volunteers in the pharmacokinetic analysis set (linear scale).](/cms/asset/78fb43e0-c918-4059-870b-0c4c73bc2a27/dddt_a_12166217_f0002_b.jpg)
Figure 3 Concentration of total radioactivity in blood and plasma and revexepride in plasma.
Notes: The lower limit of quantification for LC–MS/MS was lower than that of the assays used to determine total radioactivity, allowing plasma revexepride to be monitored for a longer period of time following administration.
Abbreviation: LC–MS/MS, liquid chromatography–mass spectrometry/mass spectrometry.
Abbreviation: LC–MS/MS, liquid chromatography–mass spectrometry/mass spectrometry.
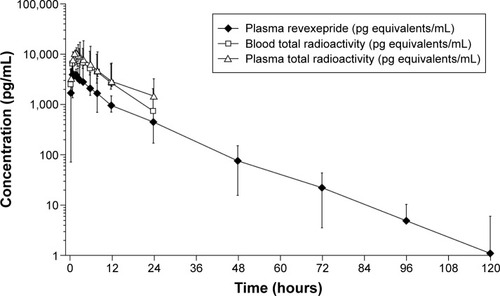
Table 3 Pharmacokinetic parameter data in whole blood and plasma