Figures & data
Figure 1 Dose–response curves of BJ extract in liver cancer cell lines.
Notes: (A) BJ inhibited growth of Hep3B cells. Liver cancer cells Huh7, Hep3B, and HepG2 were cultured in 96-well plate for 28 hours, then treated with various concentrations (0.1 mg/mL, 0.2 mg/mL, 0.5 mg/mL, and 1.0 mg/mL) of aqueous BJ extract or water for 12 hours, and stained with MTT. The cell viabilities were converted from the absorbance of drug-treated cells against that of water control. The relative viabilities were obtained by conversion into percentages compared with water treatment control as 100%. The data are the averages of quadruplicate. The results were represented as mean ± SD of three independent experiments. *P<0.05 and **P<0.01. (B) BJ induced sub-G1 populations. Hep3B, Huh7, and HepG2 cells cultured in 1% serum-supplemented RPMI-1640 were incubated with various concentrations of BJ (0.1 mg/mL, 0.2 mg/mL, 0.5 mg/mL and 1.0 mg/mL) and water control for 12 hours before being labeled with PI followed by flow cytometry analysis. (C) Two-dimensional flow analysis. Hep3B cells were treated with BJ (0.1 mg/mL, 0.2 mg/ml, 0.5 mg/mL, and 1.0 mg/mL) or water for 12 hours and the trypsinized cells were analyzed by Annexin V/PI-stained flow cytometry. (D) Quantitative analysis of Annexin V-positive cell populations. Hep3B cells were treated with various concentrations (0.1 mg/mL, 0.2 mg/mL, 0.5 mg/mL, and 1.0 mg/mL) of BJ as indicated for 12 hours and the trypsinized cells were analyzed by flow cytometry. The early (dark) and late (light) apoptotic population distributions were expressed as mean values from three independent experiments.
Abbreviations: BJ, Brucea javanica; FITC, fluorescein isothiocyanate; MTT, 3-[4, 5-dimethylthiazol-2-yl]-2, 5 diphenyl tetrazolium bromide; PI, propidium iodide; RPMI, Roswell Park Memorial Institute; SD, standard deviation.
Abbreviations: BJ, Brucea javanica; FITC, fluorescein isothiocyanate; MTT, 3-[4, 5-dimethylthiazol-2-yl]-2, 5 diphenyl tetrazolium bromide; PI, propidium iodide; RPMI, Roswell Park Memorial Institute; SD, standard deviation.
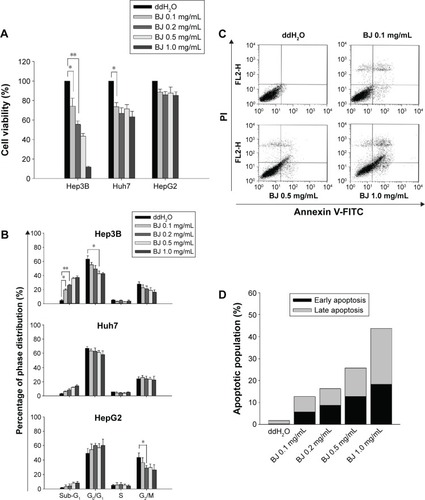
Figure 2 Release of cytochrome c from mitochondria.
Notes: Hep3B cells treated with various concentrations of BJ (0.1 mg/mL, 0.2 mg/mL, 0.5 mg/mL, and 1.0 mg/mL) and water control for 6 hours were fixed and incubated with antibody against cytochrome c followed by secondary antibody conjugated with TRITC (red). The slides were counterstained with Mitotracker (green) and DAPI (blue) before being analyzed by confocal microscopy. The arrows indicate the colocalization of red color cytochrome c and green color mitochondria, while blue color indicates nucleus (scale bar =10 µm and applies to all images).
Abbreviations: BJ, Brucea javanica; DAPI, 4′,6-diamidino-2-phenylindole; TRITC, tetramethylrhodamine isothiocyanate.
Abbreviations: BJ, Brucea javanica; DAPI, 4′,6-diamidino-2-phenylindole; TRITC, tetramethylrhodamine isothiocyanate.
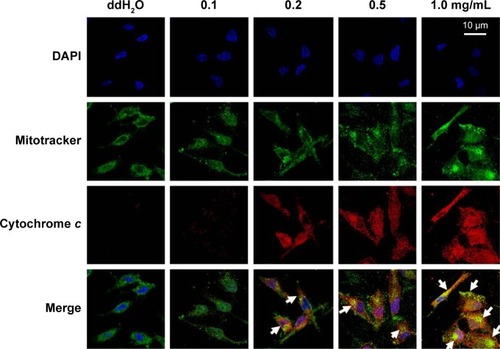
Figure 3 Effects of BJ on apoptotic features in Hep3B cells.
Notes: Liver cancer cells Huh7, Hep3B, and HepG2 cultured in 1% serum-supplemented DMEM or RPMI-1640 and incubated with various concentrations of BJ (0.1 mg/mL, 0.5 mg/mL, and 1.0 mg/mL) plus vehicle control H2O for 12 hours were collected. The protein lysates were conducted for Western blot analysis. The blots were incubated with various primary antibodies, including EGFR, Akt, phosphorylated AktS473, caspase-9, caspase-3, Bcl-2, and PARP followed by horseradish peroxidase-conjugated secondary antibodies with GAPDH as loading control. The blots were visualized by ECL staining system. The values shown underneath each blot indicate relative intensities compared with the results of ddH2O treatment for each cell line.
Abbreviations: BJ, Brucea javanica; DMEM, Dulbecco’s Modified Eagle’s Medium; ECL, enhanced chemiluminescence; EGFR, epidermal growth factor receptor; GAPDH, glyceraldehyde 3-phosphate dehydrogenase; PARP, poly(adenosine diphosphate-ribose) polymerase; RPMI, Roswell Park Memorial Institute.
Abbreviations: BJ, Brucea javanica; DMEM, Dulbecco’s Modified Eagle’s Medium; ECL, enhanced chemiluminescence; EGFR, epidermal growth factor receptor; GAPDH, glyceraldehyde 3-phosphate dehydrogenase; PARP, poly(adenosine diphosphate-ribose) polymerase; RPMI, Roswell Park Memorial Institute.
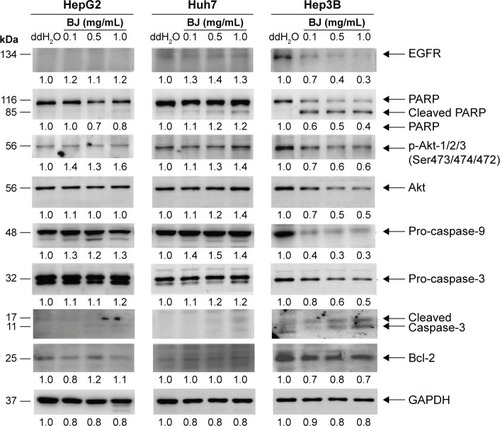
Figure 4 BJ suppressed the growth of Hep3B spheroids.
Notes: (A) Effects of BJ on the growth of multicellular spheroids. Multicellular spheroids were prepared. The representative image of Hep3B spheroid in suspension treated at each condition with 2.0 mg/mL, 4.0 mg/mL, and 6.0 mg/mL of BJ for 12 hours, 24 hours, and 48 hours, respectively, was taken under an inverted microscope (scale bar =150 µm and applies to all images). (B) Representative colony images of soft agar assay. The spheroids derived from Huh7, Hep3B, and HepG2 cells that were treated with 2.0 mg/mL, 4.0 mg/mL, and 6.0 mg/mL of BJ, respectively, for 24 hours, were seeded and grown in soft agar for 28 days and stained with crystal violet. Each representative image of colony grown in soft agar at different concentrations and water control was taken from an inverted microscope (scale bar =150 µm and applies to all images). (C) Soft agar colony forming assay. Soft agar plates of Huh7, Hep3B, and HepG2 spheroids as treated with various concentrations of BJ extract were incubated at 37°C for 28 days before being stained with 0.002% crystal violet. Colonies with >50 cells were counted as positive. (D) Statistical analysis. The numbers of colonies of soft agar formation of liver cancer spheroids from Huh7, Hep3B, and HepG2 cells treated with 2.0 mg/mL, 4.0 mg/mL, and 6.0 mg/mL of BJ were counted and plotted. *P<0.05 and **P<0.01 indicates significant difference between treatment groups and water control as determined from three independent experiments.
Abbreviation: BJ, Brucea javanica.
Abbreviation: BJ, Brucea javanica.
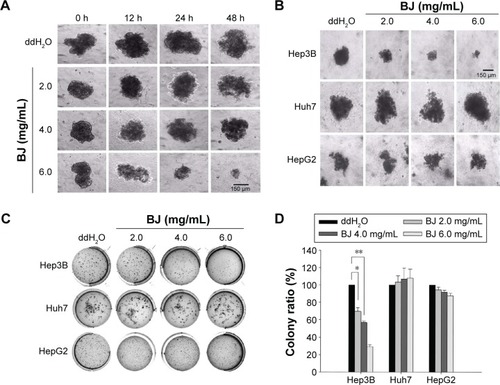
Figure 5 BJ induced apoptotic characteristics in Hep3B spheroids.
Notes: (A) Reduction of BrdU incorporation. Hep3B spheroids were treated with 2.0 mg/mL, 4.0 mg/mL, and 6.0 mg/mL of BJ, respectively, for 24 hours followed by evaluation with BrdU incorporation assay. The merged images of green BrdU and blue nucleus marker DAPI were taken by a fluorescence microscope (scale bar =100 µm and applies to all images). (B) BJ reduced BrdU incorporation. The numbers of fluorescence positive spheres with incorporated BrdU were counted in each field of different concentrations. The numbers as counted were the average of at least three different fields. The data are expressed as mean ± SD of three individual experiments (*P<0.05). (C) Dose-dependent increase of TUNEL staining. The spheroids were treated with 2.0 mg/mL, 4.0 mg/mL, and 6.0 mg/mL of BJ, respectively, for 24 hours followed by TUNEL staining evaluation. The merged images of green TUNEL and blue nucleus marker DAPI were taken by a fluorescence microscope (scale bar =100 µm and applies to all images). (D) BJ increased TUNEL positive nuclei. The numbers of fluorescent TUNEL positive spheres in each field of BJ concentration of 2.0 and 6.0 mg/mL were counted. The numbers counted were the average of at least three different fields. The data are expressed as mean ± SD of three individual experiments (*P<0.05).
Abbreviations: BJ, Brucea javanica; BrdU, bromodeoxyuridine; DAPI, 4′,6-diamidino-2-phenylindole; TUNEL, terminal deoxynucleotidyl transferase-mediated dUTP nick-end labeling.
Abbreviations: BJ, Brucea javanica; BrdU, bromodeoxyuridine; DAPI, 4′,6-diamidino-2-phenylindole; TUNEL, terminal deoxynucleotidyl transferase-mediated dUTP nick-end labeling.
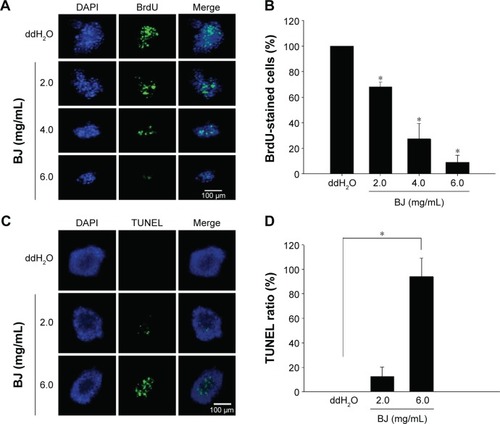
Figure 6 BJ reduced stemness marker of Hep3B spheres.
Notes: (A) Protein lysates from Hep3B spheroids treated with 2.0 mg/mL, 4.0 mg/mL, and 6.0 mg/mL of BJ extract for 12 hours were resolved by SDS-PAGE gels and transferred to nitrocellulose membranes. The blots were analyzed for expressions of different stemness markers. They included Nanog, CD133, EpCAM, and ALDH1A1 with GAPDH as loading control. The values shown underneath each blot signify relative intensities compared with the results for vehicle control water treatment. (B) Merged images of immunofluorescent detection with CD133 antibody (green) of Hep3B spheroids after BJ treatment at 2.0 mg/mL, 4.0 mg/mL, and 6.0 mg/mL of BJ for 24 hours after counterstaining with DAPI (blue) (scale bar =100 µm and applies to all images). (C) Merged images of immunofluorescent detection with Nanog antibody (green) of Hep3B spheroids after BJ treatment with counterstaining of DAPI (blue) (scale bar =100 µm and applies to all images).
Abbreviations: BJ, Brucea javanica; DAPI, 4′,6-diamidino-2-phenylindole; GAPDH, glyceraldehyde 3-phosphate dehydrogenase; PAGE, polyacrylamide gel electrophoresis; SDS, sodium dodecyl sulfate.
Abbreviations: BJ, Brucea javanica; DAPI, 4′,6-diamidino-2-phenylindole; GAPDH, glyceraldehyde 3-phosphate dehydrogenase; PAGE, polyacrylamide gel electrophoresis; SDS, sodium dodecyl sulfate.
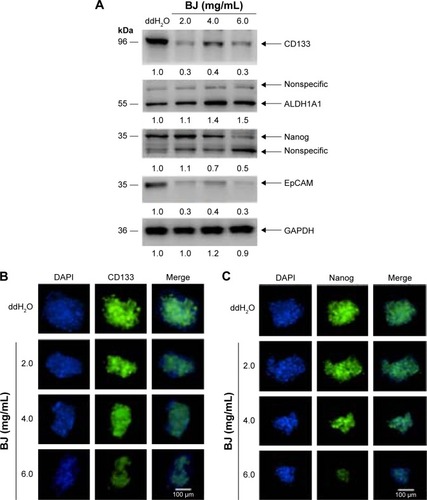
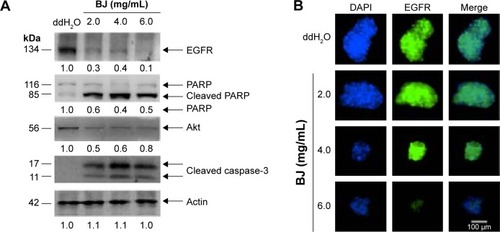
Figure 7 BJ increased apoptotic characteristics of Hep3B spheres.
Notes: (A) Protein lysates from Hep3B spheroids treated with 2.0 mg/mL, 4.0 mg/mL, and 6.0 mg/mL of BJ extract for 12 hours were resolved and transferred. The blots were analyzed for expressions of PARP, Akt, and caspase-3 with GAPDH as loading control. The values shown underneath each plot signify relative intensities compared with the results of vehicle control water treatment. (B) Merged images of immunofluorescent detection with EGFR antibody (green) of Hep3B spheroids after BJ treatment for 24 hours and DAPI counterstaining (blue) (scale bar =100 µm and applies to all images).
Abbreviations: BJ, Brucea javanica; DAPI, 4′,6-diamidino-2-phenylindole; EGFR, epidermal growth factor receptor; GAPDH, glyceraldehyde 3-phosphate dehydrogenase; PARP, poly(adenosine diphosphate-ribose) polymerase.
Abbreviations: BJ, Brucea javanica; DAPI, 4′,6-diamidino-2-phenylindole; EGFR, epidermal growth factor receptor; GAPDH, glyceraldehyde 3-phosphate dehydrogenase; PARP, poly(adenosine diphosphate-ribose) polymerase.