Figures & data
Figure 1 Enterohepatic circulation (EHC), the circulation of bile acid after oral administration.
Notes: (1) Warfarin enters the gastrointestinal tract after oral administration; (2) warfarin in the gastrointestinal tract enters the liver via the portal vein; (3) some of the warfarin in the liver is secreted into the bile duct; (4) warfarin in the bile duct enters the gastrointestinal tract through the duodenum; and (5) warfarin in the gastrointestinal tract is reabsorbed and transported back to the liver for systemic circulation.
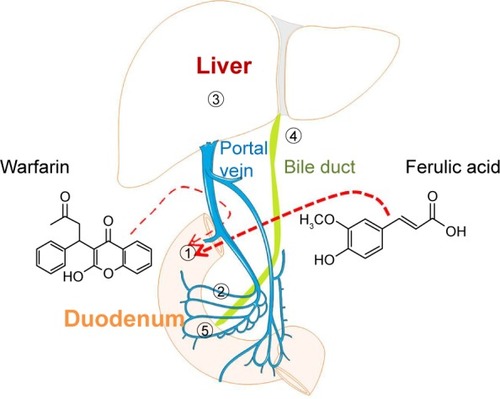
Figure 2 Representative MRM chromatograms of warfarin in rats.
Notes: (A) Blank plasma samples from healthy rats; (B) blank plasma samples spiked with warfarin and IS; (C) plasma from rats with biliary drainage after a single administration of warfarin; (D) plasma from healthy rats after a single administration of warfarin; (E) plasma from rats with biliary drainage after the administration of warfarin and ferulic acid; and (F) plasma from healthy rats after the administration of warfarin and ferulic acid.
Abbreviations: MRM, multiple-reaction monitoring; ES-TIC, electrospray – total ions chromatograph; IS, internal standard.
Abbreviations: MRM, multiple-reaction monitoring; ES-TIC, electrospray – total ions chromatograph; IS, internal standard.
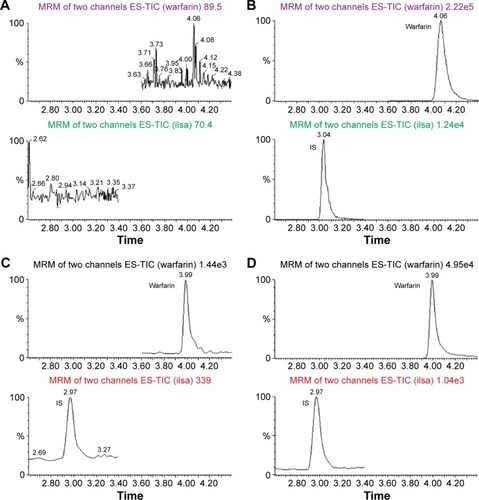
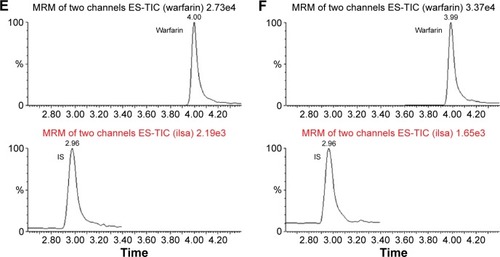
Figure 3 Ultraperformance liquid chromatography–tandem mass spectrometry spectra of warfarin and methyclothiazide.
Notes: Warfarin and methyclothiazide can be ionized under negative ionization conditions. (M–H)− predominated and was used as the precursor ion to obtain the ion spectra. The most sensitive mass transitions for warfarin (A) were m/z 307.03→250.02 and for methyclothiazide (B; IS) were 357.81→321.89.
Abbreviation: IS, internal standard.
Abbreviation: IS, internal standard.
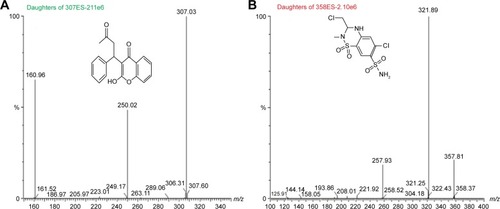
Table 1 The intraday and interday precision of warfarin in rat plasma samples
Table 2 The pharmacokinetic parameters of warfarin (mean ± SD, n=5)
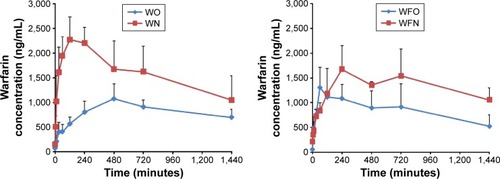
Figure 4 The mean ± SD plasma concentration–time curves for warfarin (n=5).
Notes: WN: healthy rats after a single administration of warfarin sodium (0.5 mg/kg); WO: rats with biliary drainage after a single administration of warfarin sodium (0.5 mg/kg); WFN: healthy rats after the administration of warfarin sodium and ferulic acid (0.5 mg/kg and 1.5 mg/kg, respectively); WFO: rats with biliary drainage after the administration of warfarin sodium and ferulic acid (0.5 mg/kg and 1.5 mg/kg, respectively).