
Figures & data
Table 1 Clinical characteristics of lean women with polycystic ovary syndrome and controls at the beginning of the study
Table 2 ICC, 95% CI, and SEM of PPT values at each measurement point at the beginning of the study and after 6 months observation
Figure 1 Estimated marginal means of PPT values measured on deltoid and trapezius muscle at the beginning of the study and after 6 months of observation in all studied groups. Analysis was carried out using ANOVA test with repeated measures. Significance level <0.05.
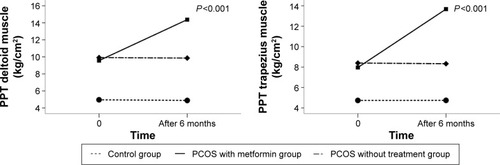
Figure 2 Estimated marginal means of plasma β-endorphins levels at the beginning of the study and after 6 months of observation in all studied groups.
Abbreviation: PCOS, polycystic ovary syndrome.
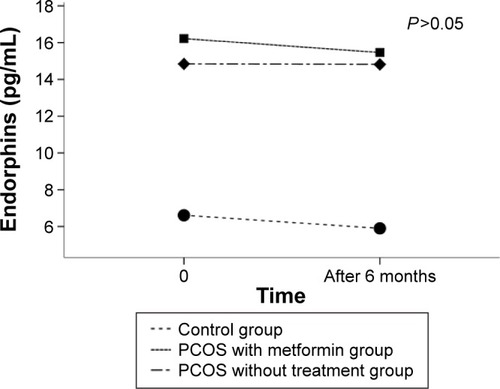
Table 3 Clinical characteristics of lean women from the PCOS with metformin group (1) at the beginning of the study and after 6 months metformin therapy