Figures & data
Table 1 Observed and predicted pharmacokinetic parameters of sarpogrelate and M-1 after single (50 mg, 100 mg, or 400 mg) and multiple (100 mg, three times for 1 day) oral administration of sarpogrelate hydrochloride
Table 2 Input parameters of sarpogrelate hydrochloride and M-1 used in the physiologically based pharmacokinetic model development
Table 3 The predicted AUC and Cmax fold ratios of CYP2D6 substrates with or without sarpogrelate hydrochloride in DDI study simulations for the ten trials with ten subjects each. For multiple dose administration, after pretreatment of sarpogrelate hydrochloride for 3 days (100 mg tid) and each CYP2D6 substrate were coadministered with sarpogrelate hydrochloride on day 4
Table 4 Inhibition of sarpogrelate and M-1 on loperamide transport in MDCK-II-P-gp and loperamide transport in MDCK-II-BCRP cells
Figure 1 Comparison of simulated and observed plasma concentration of sarpogrelate (A) and M-1 (B) after single oral dosing of sarpogrelate hydrochloride 100 mg.
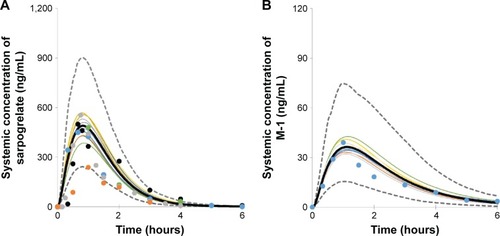
Figure 2 Sensitivity index plots of log P, B/P, fup, and fumic for sarpogrelate hydrochloride on the AUC (A, D, G, and J) and Cmax (B, E, H, and K) of sarpogrelate, and the CYP2D6 inhibition (AUC fold ratio of metoprolol [C, F, I, and L]).
![Figure 2 Sensitivity index plots of log P, B/P, fup, and fumic for sarpogrelate hydrochloride on the AUC (A, D, G, and J) and Cmax (B, E, H, and K) of sarpogrelate, and the CYP2D6 inhibition (AUC fold ratio of metoprolol [C, F, I, and L]).](/cms/asset/6347097f-21c1-4712-9c8a-dfad73450ec0/dddt_a_12166250_f0002_b.jpg)
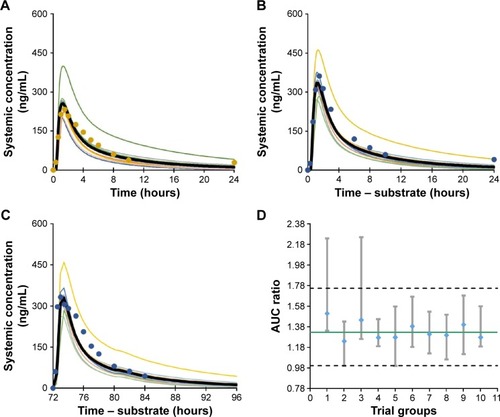
Figure 3 Simulated and observed plasma concentration–time profiles of metoprolol after a single oral dose of 100 mg (A) in the absence of sarpogrelate; (B) after single oral dose of 100 mg sarpogrelate hydrochloride; (C) after multiple oral doses of 100 mg sarpogrelate hydrochloride (tid, for 3 days); (D) median AUC ratios of metoprolol with or without sarpogrelate simulated in ten different trial groups (n=10, closed diamonds).
Abbreviations: AUC, area under the curve; tid, three times daily.