Figures & data
Table 1 The sequence of primers used for real-time polymerase chain reaction in the study
Figure 1 Body weight in studied groups.
Notes: Newborns’ body weights were not different in fluoxetine treatment group (mean: 5.75±0.05 g) and control group (mean: 5.90±0.09 g).
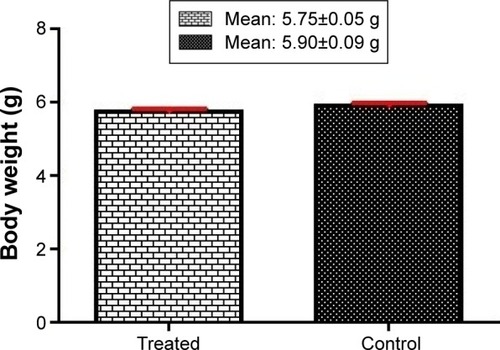
Figure 2 The lung weights.
Notes: Fluoxetine-exposed newborns’ mean lung weights (0.11±0.006 g) compared with the control newborns’ mean lung weights (0.14±0.004 g) were significantly reduced (*P=0.001).
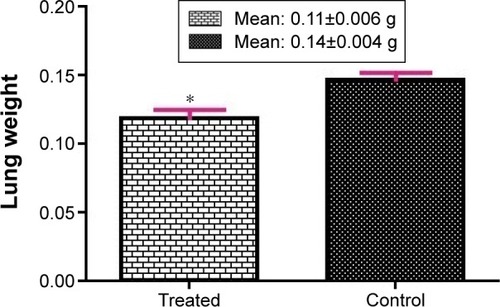
Figure 3 The number of newborns.
Notes: There was no statistically significant difference between average number of live-born infants in the fluoxetine treatment group (7±1.5) and control group (8.25±1.6).
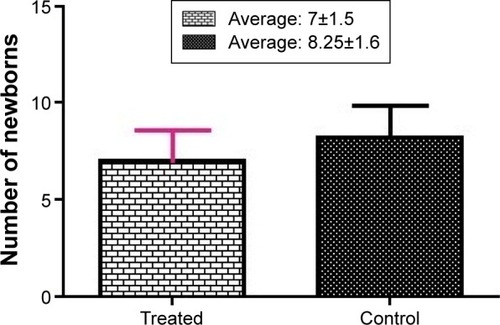
Figure 4 Fold changes of HoxB5 expression.
Note: The expression of HoxB5 in the fluoxetine treatment group compared with the control group showed a statistically significant increase (*P=0.0276).
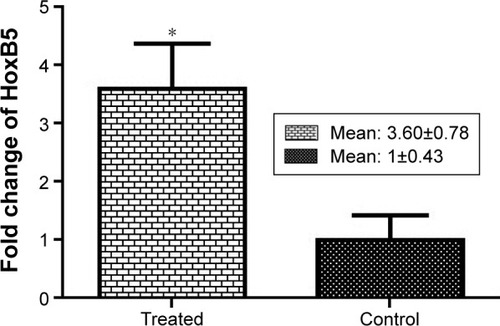
Figure 5 Fold changes of SPC expression.
Note: Expression of SPC in gene in the fluoxetine treatment group compared with control group showed an increase but this increase was nonsignificant (P=0.1226).
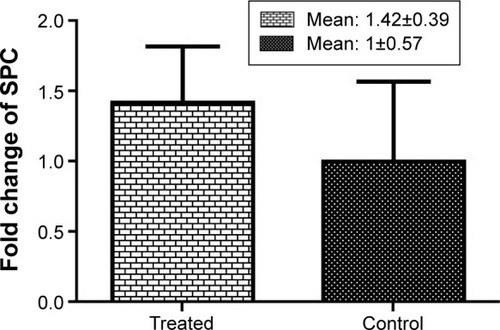
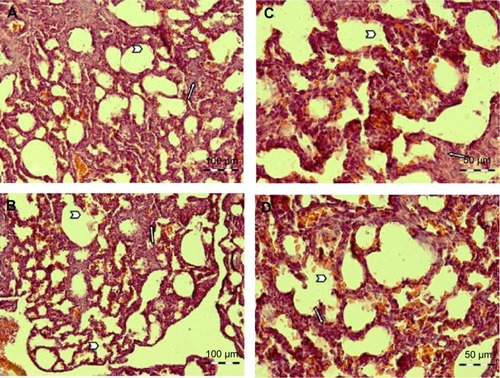
Figure 6 A representative picture of hematoxylin and eosin staining of rat lungs.
Notes: (A, B) Lung of the fluoxetine treatment group. The amount of mesenchymal tissue (arrow) is more than the control group. (C, D) Lung of the control group. The number of alveolar cells (arrowhead) are more than the fluoxetine treatment group and the walls between the alveolar cells are thin. Arrow: mesenchymal tissue. Arrowhead: alveolar cell. The magnification of (A, B) ×20 (scale bar: 100 µm). The magnification of (C, D) ×40 (scale bar: 50 µm).