Figures & data
Figure 1 Circular dichroism spectra of the chiral peptides.
Notes: Peptide L-RADA16-RGD of 50 μM has stable secondary structures in 20 mM NaCl at 25°C, 193.5 nm (13.5827), 193 nm (12.4508), and 198 nm (−15.8484).
Abbreviation: deg, degree.
Abbreviation: deg, degree.
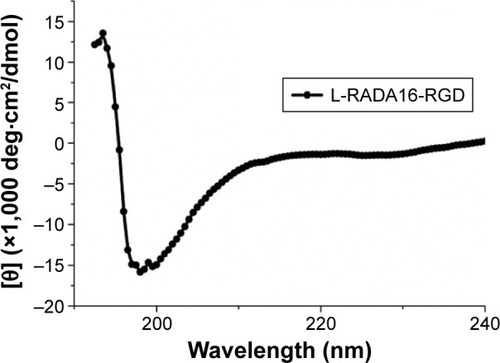
Figure 2 TEM images of microstructure of (A) L-RADA16, (B) D-RADA16, and (C) L-RADA16-RGD (200 nm).
Note: Magnification: (A) ×75,000; (B) ×60,000; and (C) ×75,000.
Abbreviation: TEM, transmission electron microscopy.
Abbreviation: TEM, transmission electron microscopy.
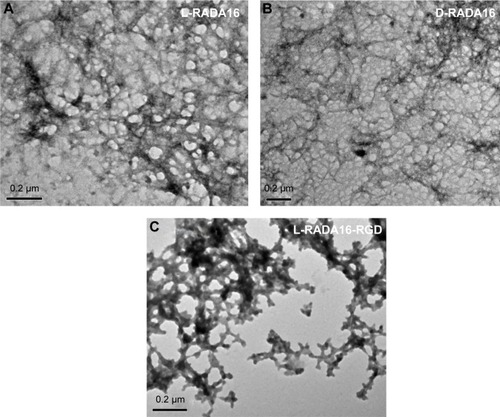
Figure 3 Rheological assays: 2.5, 5.0 mg/mL peptide hydrogels in PBS (pH 7.4), 25°C.
Notes: (A) The rheological properties of 2.5 and 5.0 mg/mL L-RADA16 hydrogels in 10.0 mg/mL PBS (pH 7.4) at 25°C. (B) The rheological properties of 2.5 and 5.0 mg/mL D-RADA16 hydrogels in 10.0 mg/mL PBS (pH 7.4) at 25°C.
Abbreviation: PBS, phosphate-buffered saline.
Abbreviation: PBS, phosphate-buffered saline.
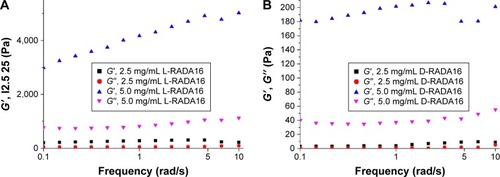
Figure 4 Release profiles for TGF-beta 1 through three types of self-assembling peptide hydrogels (data points represent the average of three samples).
Abbreviations: h, hours; TGF, transforming growth factor.
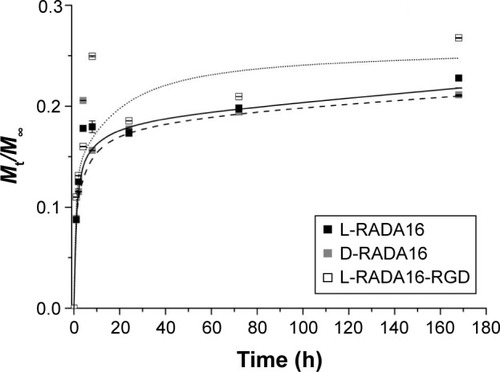
Figure 5 Release profiles for TGF-beta 1 through three types of self-assembling peptide hydrogels 3D cells coculture (data points represent the average of three samples).
Abbreviations: h, hours; TGF, transforming growth factor; 3D, three-dimensional.
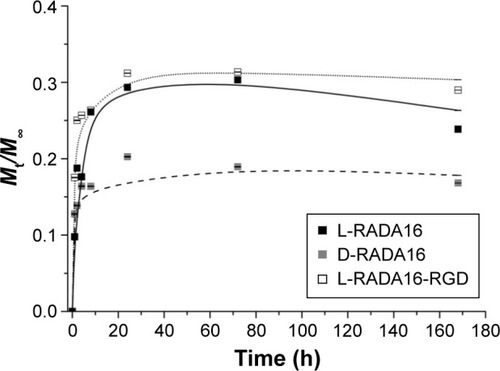
Figure 6 Proliferation effect of released TGF-beta 1 over bone mesenchymal stem cells.
Notes: The cells and RADA16 hydrogels contained TGF were co-cultured for 3 days (A), 7 days (B), and 14 days (C). CCK-8 assay for proliferated progeny (n=5). In the case of L-RADA16, a long-term effect of released TGF-beta 1 is evidenced by significantly higher total cell population. The TGF-beta 1 mitogenic activity can be appreciated till 2 weeks after being mixed with the self-assembling scaffolds. *P<0.05.
Abbreviations: TGF, transforming growth factor; OD, optical density.
Abbreviations: TGF, transforming growth factor; OD, optical density.
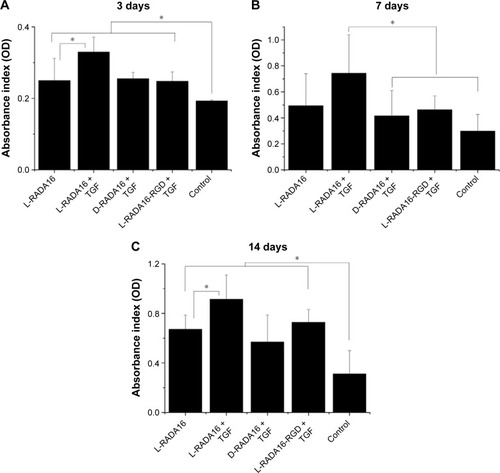
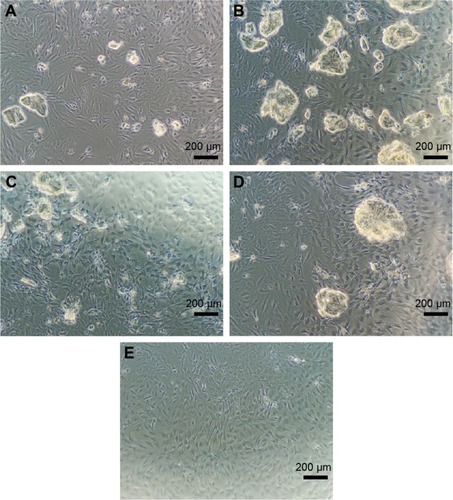
Figure 7 The morphological results of BMSC in each group under a light microscope (×100).
Notes: (A) L-RADA16 group, (B) L-RADA16 + TGF-beta 1 group, (C) D-RADA16 + TGF-beta 1 group, (D) L-RADA16-RGD + TGF-beta 1 group, and (E) negative control.
Abbreviations: BMSC, bone mesenchymal stem cells; TGF, transforming growth factor.
Abbreviations: BMSC, bone mesenchymal stem cells; TGF, transforming growth factor.