Figures & data
Table 1 Primer sequences used in the real-time quantitative PCR for detection of the transcription activities of Wnt, β-catenin, NF-κB, COX-2, DKK-1, CDNK-1A, TGF-β1, Smad4, and β-actin genes including the corresponding gene’s accession numbers
Table 2 Effects of thymoquinone (TQ) and/or 5-fluorouracil (5-FU) therapy
Figure 1 Representative photos of macroscopic and microscopic appearance of colorectal mucosa.
Abbreviations: AOM, azoxymethane; 5-FU, 5-fluorouracil; TQ, thymoquinone; H&E, hematoxylin and eosin.
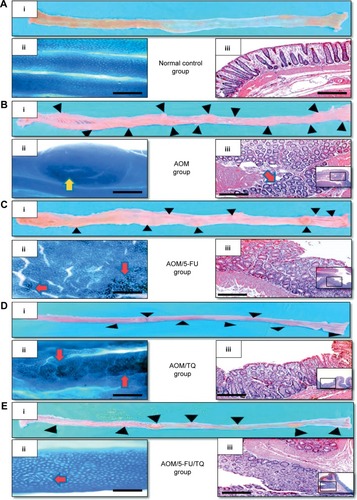
Figure 2 Findings of quantitative real-time polymerase chain reaction.
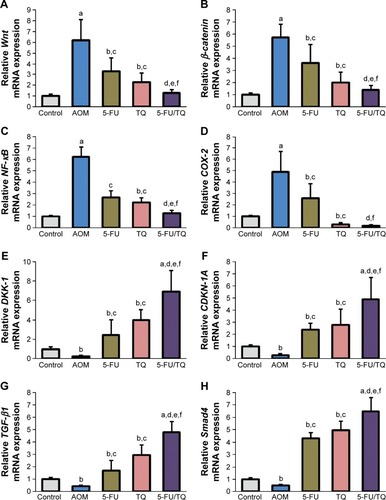
Figure 3 Enzyme-linked immunosorbent assay findings.
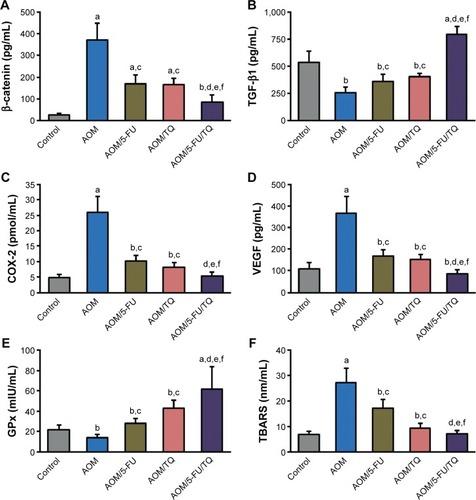
Table 3 Immunohistochemistry scores for the effects of thymoquinone (TQ) and/or 5-fluorouracil (5-FU)
Figure 4 Representative photos of immunohistochemical findings.
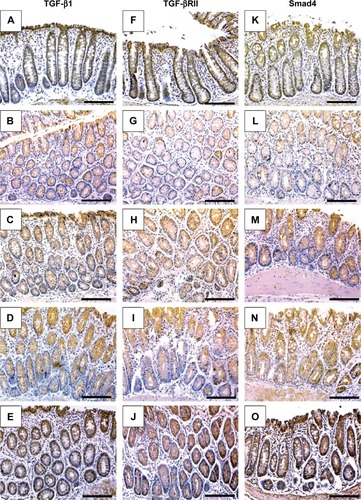
Figure 5 Representative photos of immunohistochemical findings.
Abbreviation: iNOS, inducible nitric oxide synthase.
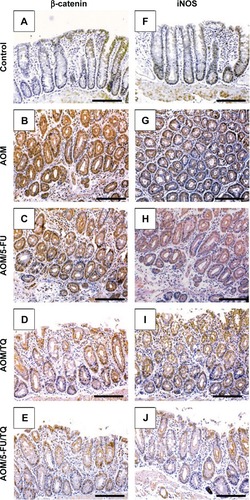
Figure S1 Corresponding histopathological features of colorectal tissues stained with Alcian blue.
Abbreviations: AOM, azoxymethane; TQ, thymoquinone; 5-FU, 5-fluorouracil.