Figures & data
Table 1 Bone biomechanical properties and serum biochemical analyses of lupus mice undergoing different treatments
Figure 1 Representative micro-CT photographs of PTM in lupus mice undergoing different treatments.
Abbreviations: BV, bone volume; GC, glucocorticoid; micro-CT, micro-computed tomography; PTM, proximal tibial metaphysis; Sal, salvianolate; TV, tissue volume.
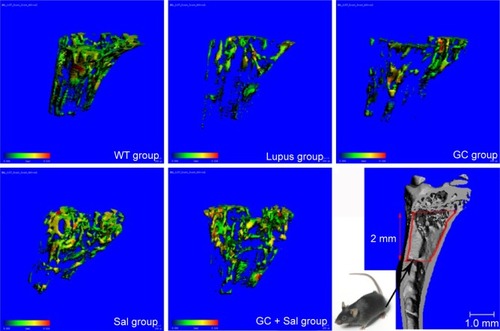
Figure 2 Micro-CT analysis of proximal tibial metaphysis (PTM) and monitored body weight data of lupus mice undergoing different treatments.
Abbreviations: BS/BV, bone surface to bone volume; BV/TV, bone volume to tissue volume; Conn.D, connectivity density; GC, glucocorticoid; micro-CT, micro-computed tomography; Sal, salvianolate; SD, standard deviation; SMI, structure model index; Tb.N, trabecular number; Tb.Sp, trabecular separation; Tb.Th, trabecular thickness.
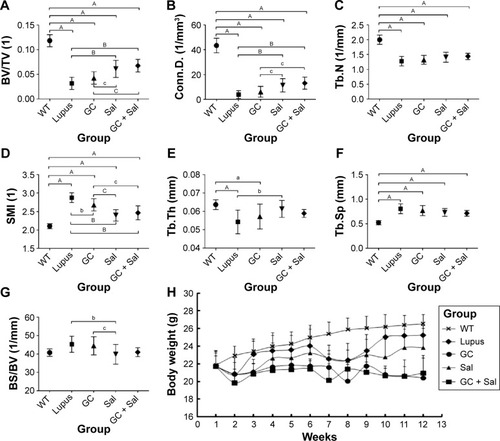
Figure 3 Representative bone fluorescence micrographs of PTM (calcein fluorescence, magnification: 40×), osteoblast morphology (undecalcified sectioning with toluidine blue staining, magnification: 40×), and bone histomorphometry analysis in lupus mice undergoing different treatments.
Abbreviations: BFR/BS, bone formation rate to bone surface; BV/TV, bone volume to tissue volume; GC, glucocorticoid; LBGR, longitudinal bone growth rate; MAR, mineral apposition rate; MS/BS, the ratio of mineralizing surface to bone surface; Ob.S/BS, osteoblast surface per unit of bone surface; Oc.S/BS, osteoclast surface per unit of bone surface; PTM, proximal tibial metaphysis; Sal, salvianolate; SD, standard deviation.
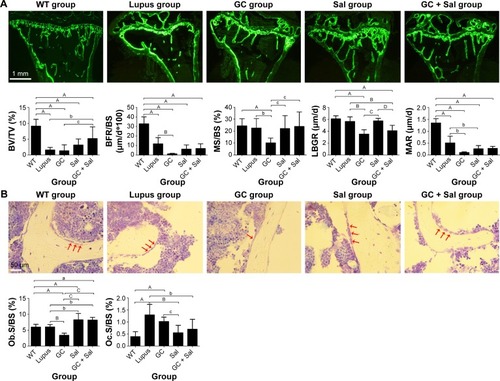
Figure 4 Immunoblotting analysis of RANKL and IL-6 expression in lumbar vertebrae and immunohistochemistry staining for IL-6 expression in the distal femur.
Abbreviations: GC, glucocorticoid; IL, interleukin; RANKL, receptor activator of nuclear factor kappa-B ligand; Sal, salvianolate; SD, standard deviation.
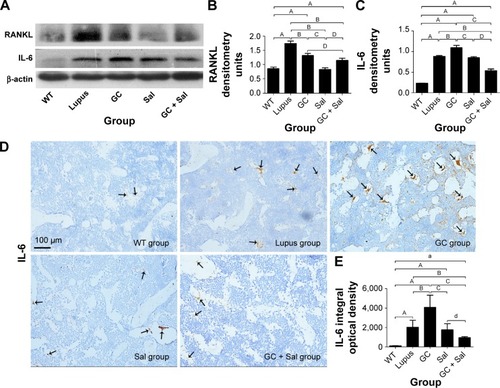
Figure 5 Immunoblotting analysis of ROS, PPARγ, and RUNX2 in the lumbar vertebrae of lupus mice undergoing different treatments.
Abbreviations: GC, glucocorticoid; PPARγ, peroxisome proliferator activated receptor gamma; ROS, reactive oxygen species; RUNX2, runt-related transcription factor 2; Sal; salvianolate; SD, standard deviation.
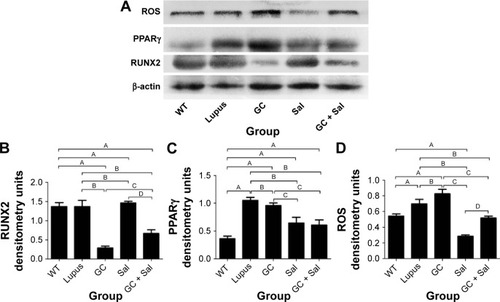
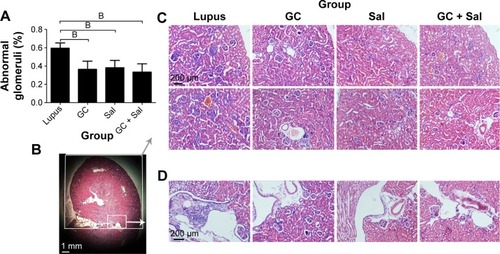
Figure 6 Renal pathological changes in lupus mice undergoing different treatments (magnification: 10×, H&E stained).
Abbreviations: GC, glucocorticoid; H&E, hematoxylin and eosin; Sal, salvianolate; SD, standard deviation.