Figures & data
Figure 1 Chemical structures of (A) puerarin, (B) paeoniflorin, and (C) menthol.
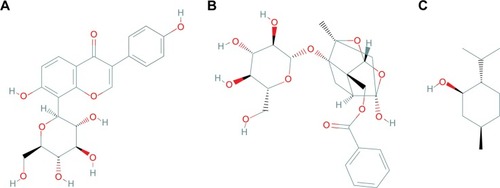
Figure 2 Cytotoxicity of puerarin, paeoniflorin, menthol, and their combinations as assessed by MTT test in Calu-3 cells for 24 hours.
Abbreviations: MTT, 3-(4,5-dimethylthiazol-2-yl)-2,5-diphenyltetrazolium bromide; SD, standard deviation.
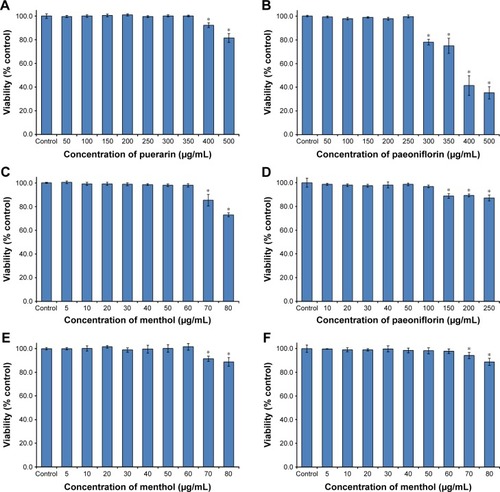
Table 1 Transport of increasing puerarin concentrations across Calu-3 cell monolayers
Table 2 Effects of paeoniflorin (Pa) and menthol (Me) on puerarin (Pu) transport in Calu-3 cells
Figure 3 The trend of TEER change in A→B and B→A transport in Calu-3 cells after treatment with puerarin, either alone or in combination with paeoniflorin and menthol.
Abbreviations: TEER, transepithelial electrical resistance; min, minutes; SD, standard deviation; P, puerarin; PP, puerarin and paeoniflorin; PM, puerarin and menthol; PPM; puerarin, paeoniflorin and menthol.
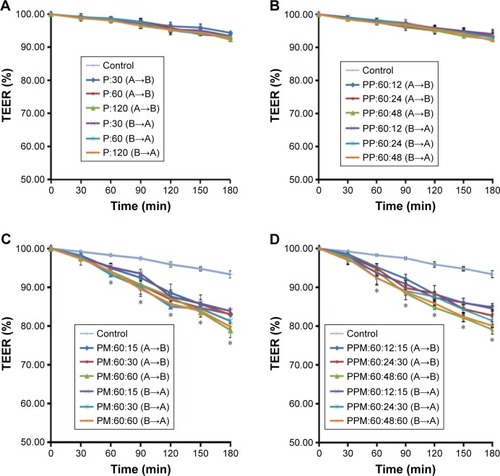
Figure 4 Effects of puerarin, paeoniflorin, and menthol on TJ proteins in Calu-3 cells.
Abbreviation: TJ, tight junction.
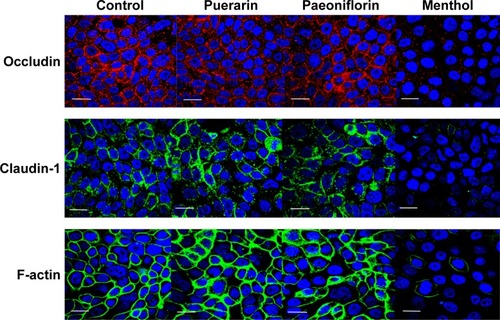
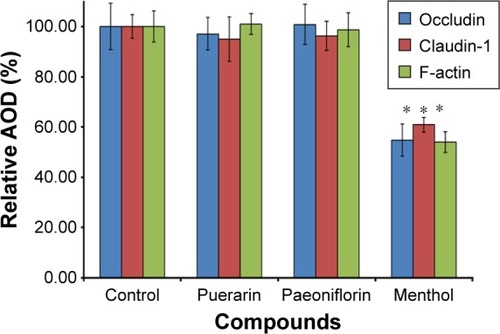
Figure 5 Changes to the relative AOD of occludin, claudin-1, and F-actin in Calu-3 cells after treatment with different compounds.
Abbreviations: AOD, average optical density; TJ, tight junction; SD, standard deviation.