Figures & data
Table 1 Clinical parameters of EAE
Figure 1 Treatment with moringin ameliorates clinical score in EAE mice.
Notes: (A) Chemical structure and enzymatic reaction for bioactivation of glucomoringin by myrosinase. (B) Clinical disease score. Scores expressed as mean ± SEM of all measurements of each experimental group. Naïve group (n=5), EAE group (n=10), EAE + moringin (n=10). Naïve vs EAE, **P=0.0018; naïve vs EAE + moringin, **P=0.005; EAE vs EAE + moringin, **P=0.0019. One way-analysis of variance with Bonferroni test were used to determine the statistical significance of differences. Data are expressed as mean ± SEM.
Abbreviations: EAE, experimental autoimmune encephalomyelitis; SEM, standard error of mean; GMG, glucomoringin; ITC, isothiocyanate.
Abbreviations: EAE, experimental autoimmune encephalomyelitis; SEM, standard error of mean; GMG, glucomoringin; ITC, isothiocyanate.
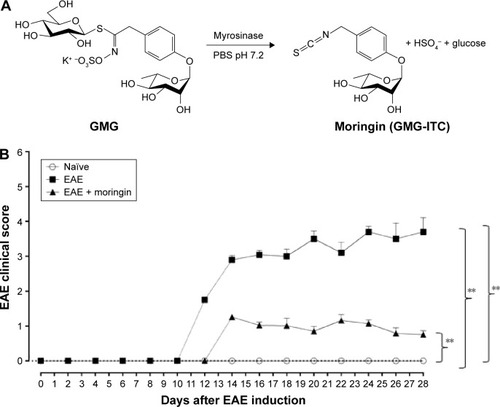
Figure 2 Moringin modulates the Wnt–β-catenin signaling pathway in EAE.
Notes: Western blot analysis for Wnt1 (A). Naïve vs EAE, *P=0.0108; EAE vs EAE + moringin, ##P=0.0014. Western blot analysis for GSK3β (B). Naïve vs EAE, ****P<0.0001; EAE vs EAE + moringin, ####P<0.0001. Western blot analysis for CK2α. (C). Naïve vs EAE, **P=0.0022; EAE vs EAE + moringin, ##P=0.0024. Western blot analysis for β-catenin (D). Naïve vs EAE, *P=0.0112; EAE vs EAE + moringin, ##P=0.0028. Western blot analysis for p-β-catenin (E). Naïve vs EAE, ***P=0.0002; EAE vs EAE + moringin, ###P=0.0002. All Western blot analyses were performed on spinal cord tissues sampled at 28 days from EAE induction. β-Actin was used as internal control. Blots are representative of three separate and reproducible experiments. Statistical analysis was carried out on three repeated blots performed on separate experiments. One way-analysis of variance with Bonferroni test were used to determine the statistical significance of differences, Data are expressed as mean ± SEM.
Abbreviations: EAE, experimental autoimmune encephalomyelitis; Ctl, control; ND, not detectable.
Abbreviations: EAE, experimental autoimmune encephalomyelitis; Ctl, control; ND, not detectable.
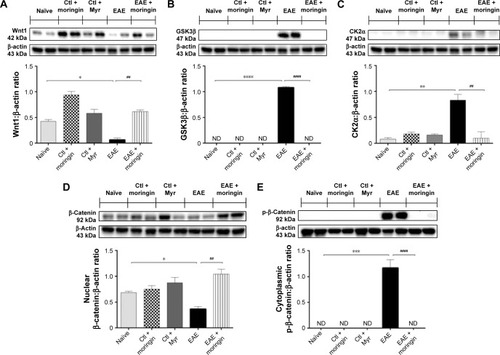
Figure 3 Moringin modulates Fas-ligand expression in EAE.
Notes: Immunohistochemical localization for Fas ligand in spinal cord tissues from naïve mice (A), Ctl + moringin (B), Ctl + Myr (C), EAE mice (D), and EAE mice pretreated with moringin (E). All images are representative of three independent experiments. The arrows indicate positive staining for FAs-ligand in cytoplasmic membranes of spinal cord tissues.
Abbreviations: EAE, experimental autoimmune encephalomyelitis; Ctl, control.
Abbreviations: EAE, experimental autoimmune encephalomyelitis; Ctl, control.
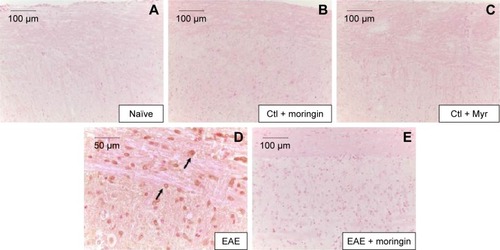
Figure 4 Moringin modulates cleaved caspase-9 expression in EAE.
Notes: Immunohistochemical localization for cleaved caspase 9 in naïve mice (A), Ctl + moringin (B), Ctl + Myr (C), EAE mice (D), and EAE mice pretreated with moringin (E). All images are representative of three independent experiments. The arrows indicate positive staining for cleaved caspase-9 in nuclei of spinal cord tissues.
Abbreviations: EAE, experimental autoimmune encephalomyelitis; Ctl, control.
Abbreviations: EAE, experimental autoimmune encephalomyelitis; Ctl, control.
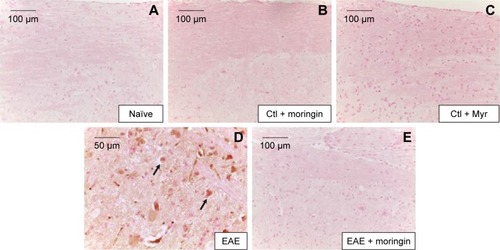
Figure 5 Moringin modulates CD4 expression in EAE.
Notes: Immunohistochemical evaluation for CD4 in naïve mice (A), Ctl + moringin (B), Ctl + Myr (C), EAE mice (D), and EAE mice pretreated with moringin (E). All images are representative of three independent experiments.
Abbreviations: EAE, experimental autoimmune encephalomyelitis; Ctl, control.
Abbreviations: EAE, experimental autoimmune encephalomyelitis; Ctl, control.
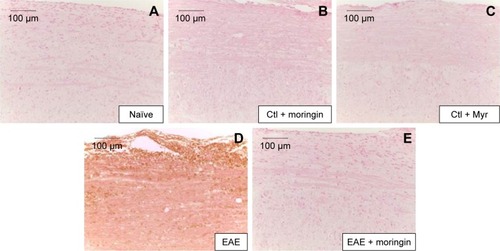
Figure 6 Moringin modulates FoxP3 expression in EAE.
Notes: Immunohistochemical evaluation for FoxP3-naïve mice (A), Ctl + moringin (B), Ctl + Myr (C), EAE mice (D), and EAE mice pretreated with moringin (E). All images are representative of three independent experiments.
Abbreviations: EAE, experimental autoimmune encephalomyelitis; Ctl, control.
Abbreviations: EAE, experimental autoimmune encephalomyelitis; Ctl, control.
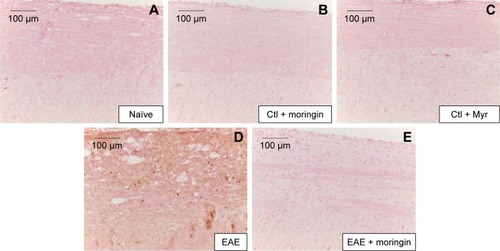
Figure 7 Moringin modulates IL-1β expression in EAE.
Notes: Immunohistochemical localization for IL-1β in spinal cord tissues from naïve mice (A), Ctl + moringin (B), Ctl + Myr (C), EAE mice (D), and EAE mice pretreated with moringin (E). All images are representative of three independent experiments. The arrows indicate positive staining for inflammatory cells in vascular endothelium of spinal cord tissues.
Abbreviations: EAE, experimental autoimmune encephalomyelitis; Ctl, control.
Abbreviations: EAE, experimental autoimmune encephalomyelitis; Ctl, control.
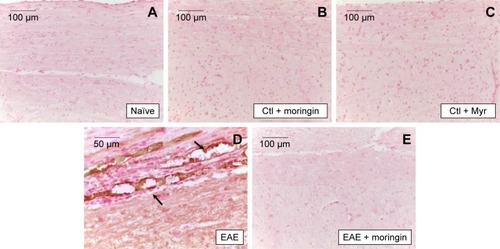
Figure 8 Moringin modulates IL-6 expression in EAE.
Notes: Immunohistochemical evaluation for IL-6 in naïve mice (A), Ctl + moringin (B), Ctl + Myr (C), EAE mice (D), and EAE mice pretreated with moringin (E). All images are representative of three independent experiments. The arrows indicate positive staining for inflammatory cells in vascular endothelium of spinal cord tissues.
Abbreviations: EAE, experimental autoimmune encephalomyelitis; Ctl, control.
Abbreviations: EAE, experimental autoimmune encephalomyelitis; Ctl, control.
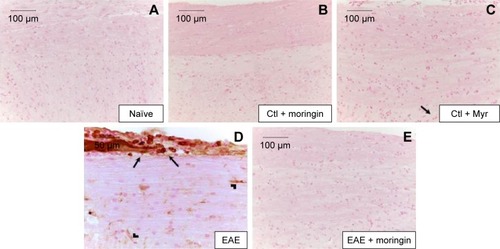
Figure 9 Moringin-modulated inflammatory mediators and Nrf2 activity in EAE.
Notes: Western blot analysis for COX2 (A). Naïve vs EAE, ***P=0.0005; EAE vs EAE + moringin, ##P=0.0012. Western blot analysis for PPARγ (B). EAE vs EAE + moringin, ##P=0.0038. Western blot analysis for Nrf2 (C). Naïve vs EAE, **P=0.0039; EAE vs EAE + moringin, ##P=0.003. All Western blot analyses were performed on spinal cord tissues sampled at 28 days from EAE induction. β-Actin was used as internal control. Blots are representative of three separate and reproducible experiments. Statistical analysis was carried out on three repeated blots performed on separate experiments. Data are expressed as mean ± SEM.
Abbreviations: EAE, experimental autoimmune encephalomyelitis; Ctl, control; ND, not detectable.
Abbreviations: EAE, experimental autoimmune encephalomyelitis; Ctl, control; ND, not detectable.
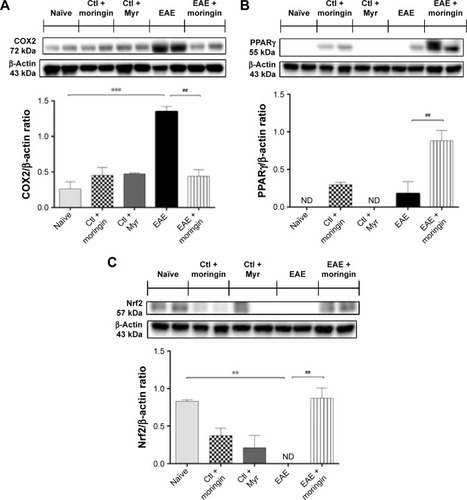
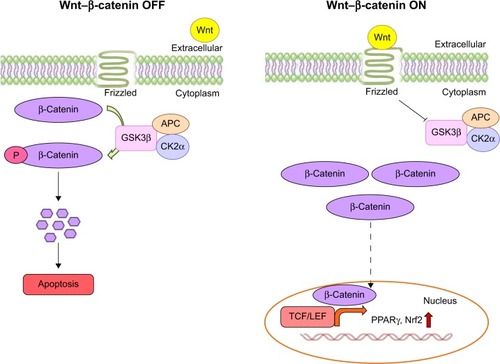
Figure 10 Wnt–β-catenin canonical pathway.
Notes: In the absence of the Wnt ligand (off), β-catenin is phosphorylated by the destruction complex formed by Axin, APC, CK2α, and GSK3β, leading to β-catenin degradation and subsequent induction of neuronal cell death. In the presence of the Wnt ligand, the Wnt canonical pathway is activated (on), and β-catenin is not phosphorylated by the destruction complex formed by Axin, APC, CK2α, and GSK3β. Therefore, β-catenin is free to translocate into the nucleus, where it binds with the TCF/LEF transcription factors and promotes the transcription of Wnt target genes.