Figures & data
Figure 1 Study design.
Abbreviations: bid, twice daily; EVO, evogliptin, 5 mg od for 7 days; MET, metformin IR, 1,000 mg bid for 7 days; od, once daily; OGTT, oral glucose tolerance test; PD, pharmacodynamics; PK, pharmacokinetic; EVO + MET, coadministration of EVO and MET.
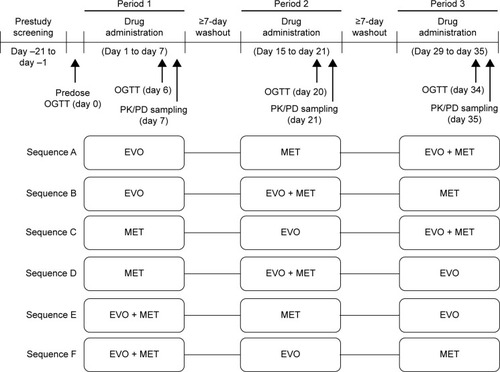
Table 1 Pharmacokinetic parameters for evogliptin and metformin, measured at steady state, after the last dose in a 7-day interval of EVO, MET, or EVO + MET treatment
Figure 2 Mean plasma concentration–time profiles of (A) evogliptin and (B) metformin after treatment with EVO, MET, or EVO + MET.
Abbreviations: bid, twice daily; EVO, evogliptin, 5 mg od for 7 days; h, hours; MET, metformin IR, 1,000 mg bid for 7 days; od, once daily; EVO + MET, coadministration of EVO and MET.
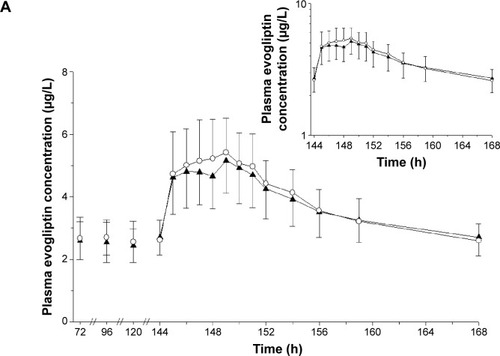
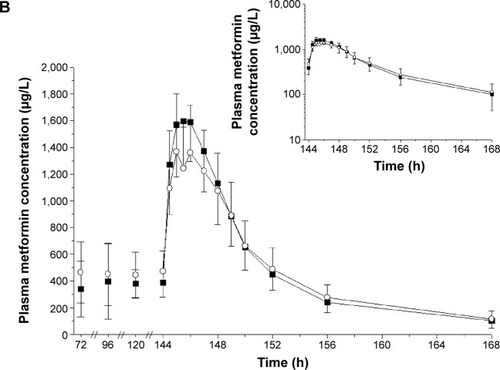
Table 2 Comparison of the inhibitory effect of evogliptin on DPP-4 activity, measured at steady state, after the last dose in a 7-day interval of EVO or EVO + MET treatment
Figure 3 Time course of the inhibition (%) of DPP-4 activity compared to baseline, after treatment with EVO or EVO + MET.
Abbreviations: bid, twice daily; DPP-4, dipeptidyl peptidase-4; EVO, evogliptin, 5 mg od for 7 days; h, hours; MET, metformin IR, 1,000 mg bid for 7 days; od, once daily; EVO + MET, coadministration of EVO and MET.
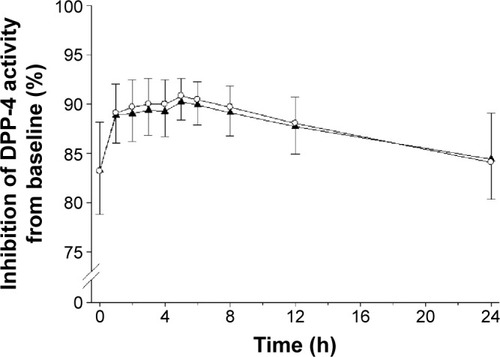
Table 3 Comparisons of the areas under the concentration–time curves for active GLP-1, glucose, glucagon, insulin, and C-peptide, measured during oral glucose tolerance test, delivered before (baseline) and after treatments with EVO, MET, and EVO + MET
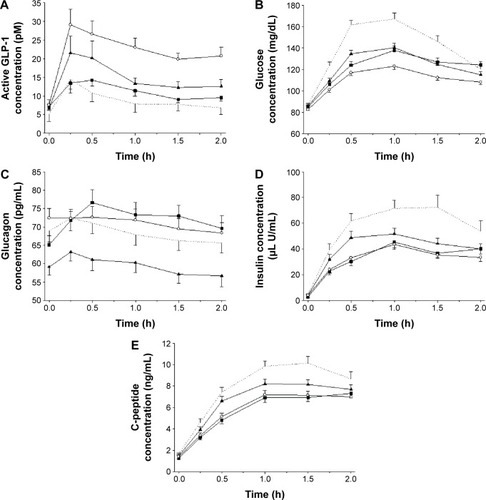
Figure 4 Mean concentration–time profiles during an oral glucose tolerance test for (A) active GLP-1, (B) glucose, (C) glucagon, (D) insulin, and (E) C-peptide, measured before (baseline) and after treatments with EVO, MET, and EVO + MET.
Abbreviations: bid, twice daily; EVO, evogliptin, 5 mg od for 7 days; GLP-1, glucagon-like peptide-1; h, hours; MET, metformin IR, 1,000 mg bid for 7 days; od, once daily; EVO + MET, coadministration of EVO and MET.