Figures & data
Figure 1 Flowchart showing study-selection procedure.
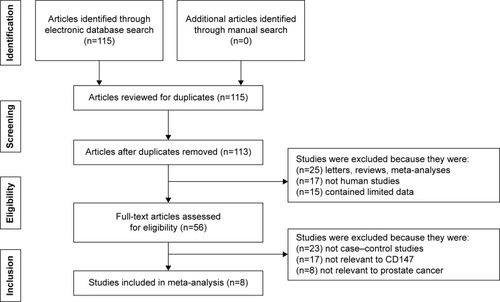
Table 1 Characteristics of the eligible studies included in the meta-analysis
Figure 2 Forest plots for the relationship between CD147 expression and prostate cancer.
Note: The data are for case versus control.
Abbreviations: CI, confidence interval; OR, odds ratio.
Abbreviations: CI, confidence interval; OR, odds ratio.
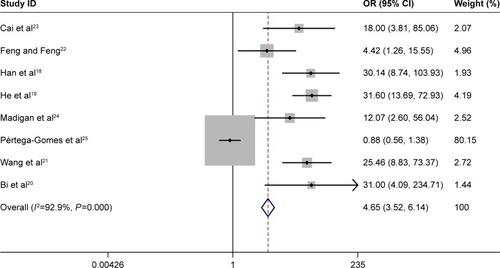
Figure 3 Subgroup analysis of the relationship between CD147 expression and prostate cancer.
Note: The data are for case versus control.
Abbreviations: CI, confidence interval; OR, odds ratio.
Abbreviations: CI, confidence interval; OR, odds ratio.
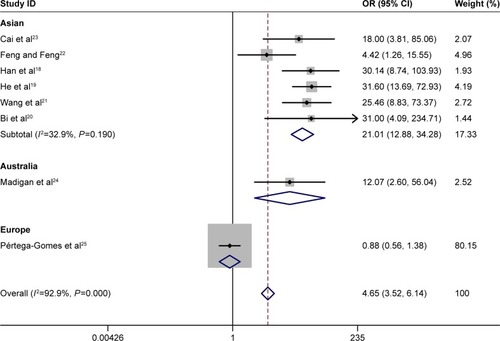
Figure 4 Forest plots for the relationship between CD147 expression and clinicopathological characteristics of prostate cancer.
Abbreviations: CI, confidence interval; OR, odds ratio; PSA, prostate-specific antigen; TNM, tumor–node–metastasis.
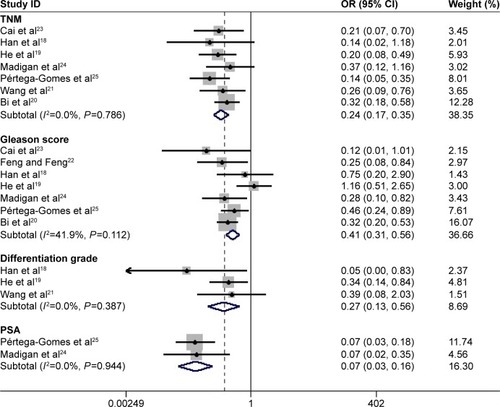
Figure 5 Sensitivity analyses of the summary odds ratio coefficients.
Abbreviations: CI, confidence interval; OR, odds ratio; TNM, tumor–node–metastasis.
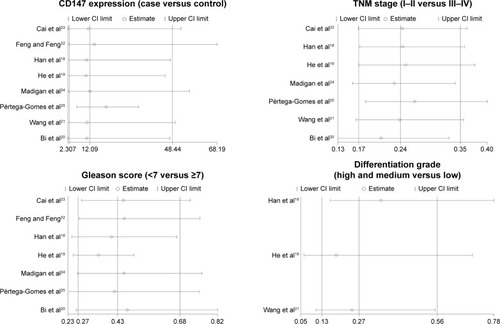
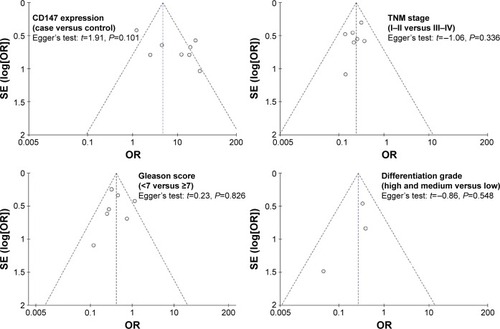
Figure 6 Funnel plots of publication biases.
Abbreviations: CI, confidence interval; OR, odds ratio; SE, standard error; TNM, tumor–node–metastasis.