Figures & data
Figure 1 Mechanistic pathway for CYP450-catalyzed demethylation of alkylamines.
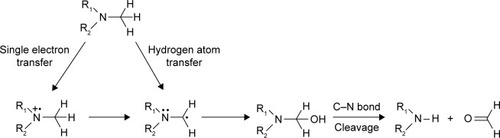
Figure 2 Chemical structure of (A) ENT and (B) d3-ENT.
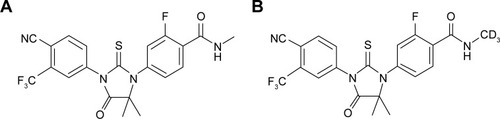
Table 1 UPLC/Q-TOF MS data for ENT and d3-ENT metabolites detected in HLMs
Figure 3 Relative metabolite formation of M6 and M7 after incubation for 4 hours with liver microsomes from different species.
Abbreviations: ENT, enzalutamide; d3-ENT, deuterated enzalutamide; HLM, human liver microsomes; cyLM, monkey liver microsomes; DLM, dog liver microsomes; RLM, rat liver microsomes; MLM, mouse liver microsomes; UV, ultraviolet; UPLC/Q-TOF MS, ultra-high-performance liquid chromatography/quadrupole time-of-flight mass spectrometry.
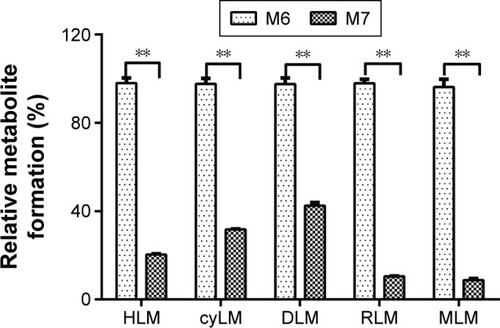
Figure 4 Relative parent remaining of ENT, d3-ENT, and M2 (concentration: 1 μM each) in rat plasma after incubation for up to 6 hours.
Abbreviations: ENT, enzalutamide; d3-ENT, deuterated enzalutamide; M2, N-demethyl metabolite of ENT.
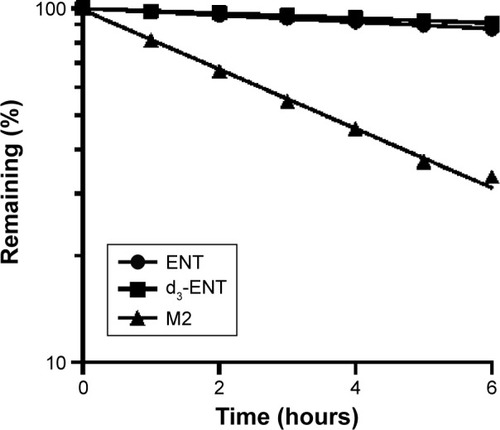
Figure 5 Plasma concentration–time profiles for M1 and M2 after intravenous administration of 5 mg/kg M2 (dissolved in PEG200/Tween 80/saline solution 1/1/100, v/v) in male Sprague Dawley rats.
Abbreviations: M1, amide hydrolysis metabolite of enzalutamide; M2, N-demethyl metabolite of enzalutamide; PEG, polyethylene glycol.0
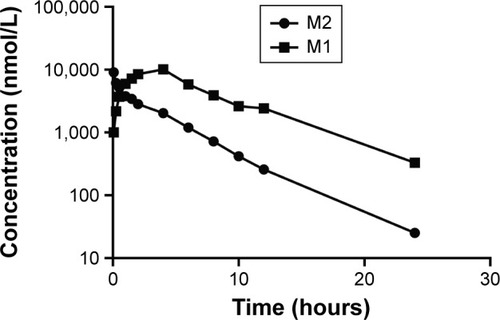
Table 2 Intrinsic clearance values for ENT and d3-ENT in liver microsomes
Figure 6 Kinetic profiles for the substrate depletion of ENT (left) and d3-ENT (right) in (A) RLM and (B) HLM.
Abbreviations: ENT, enzalutamide; d3-ENT, deuterated enzalutamide; RLM, rat liver microsomes; HLM, human liver microsomes.
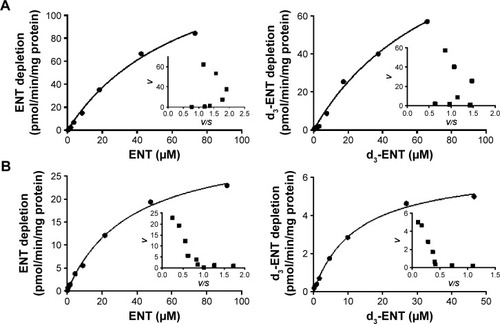
Figure 7 Proposed metabolic pathways of d3-ENT in rat.
Abbreviation: d3-ENT, deuterated enzalutamide.
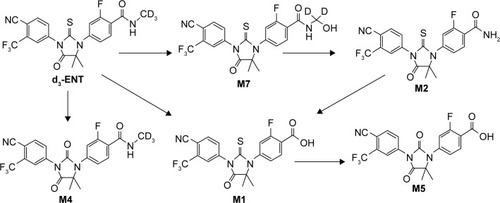
Figure 8 Plasma concentration–time profiles for (A) M1 and (B) M2 after oral administration of 20 mg/kg ENT and d3-ENT to male Sprague Dawley rats, respectively. Notes: Data are the mean ± SD of four rats. M1 and M2 are the amide hydrolysis metabolite and N-demethylation metabolite, respectively.
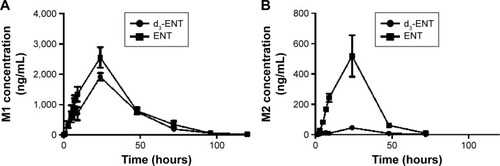
Table 3 Pharmacokinetic parameters in male rats after simultaneous administration of a 1:1 formulation of ENT and d3-ENT (10/10 mg/kg)
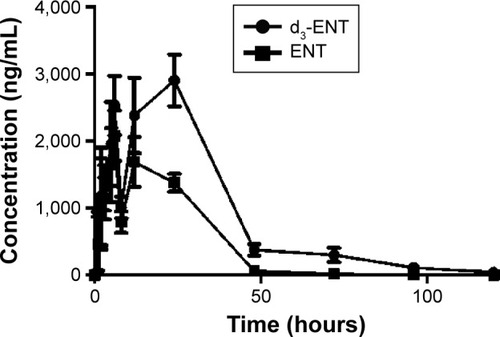
Figure 9 Plasma concentration–time profiles for ENT and d3-ENT after simultaneous oral administration of a 1:1 formulation of ENT and d3-ENT (10/10 mg/kg) in male Sprague Dawley rats.
Abbreviations: ENT, enzalutamide; d3-ENT, deuterated enzalutamide; SD, standard deviation.