
Figures & data
Figure 1 Examples of potent PTP inhibitors.
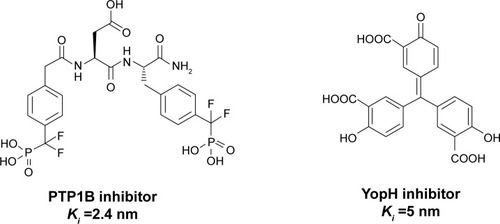
Table 1 Median values of druggability score (Dscore) and other SiteMap factors obtained by the 17 pathogenic PTPs studied in this work
Figure 2 Box plots showing the range and distribution of druggability for each PTP across available structures passing imposed filters.
Abbreviations: Dscore, druggability score; PTP, protein tyrosine phosphatase.
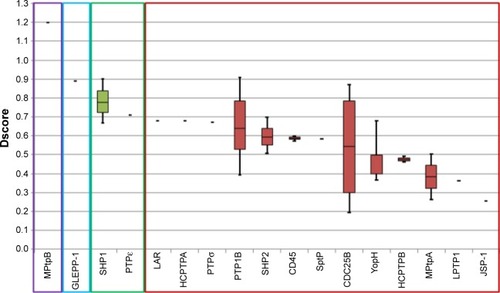
Figure 3 The binding site of four PTP classes exemplified by the surfaces of representative example.
Abbreviation: PTP, protein tyrosine phosphatase.
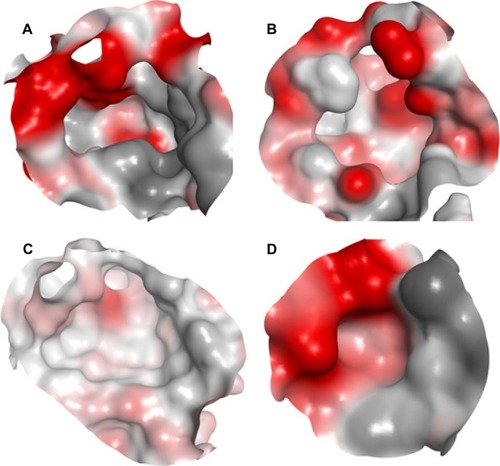
Figure 4 The correlation between the druggability of examined PTPs and their pocket size, enclosure and hydrophilicity.
Abbreviations: Dscore, druggability score; PTP, protein tyrosine phosphatase.
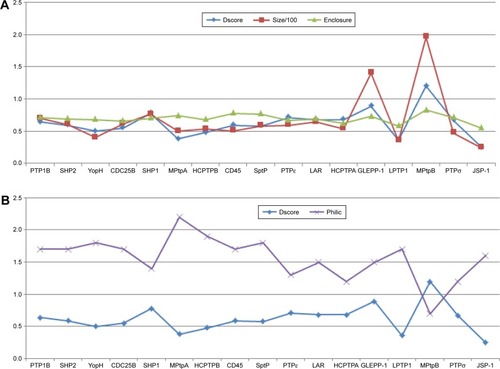
Table 2 Median values for Dscore and pocket size (number of spheres) obtained by the apo form and ligand-bound form of the 17 PTPs studied here
Figure 5 The active site of two crystal structures of CDC25B aligned on each other.
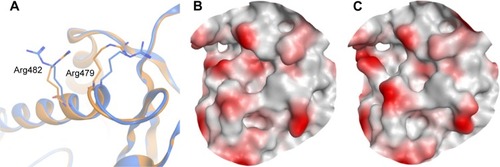
Figure 6 Five crystal structures of YopH aligned on each other.
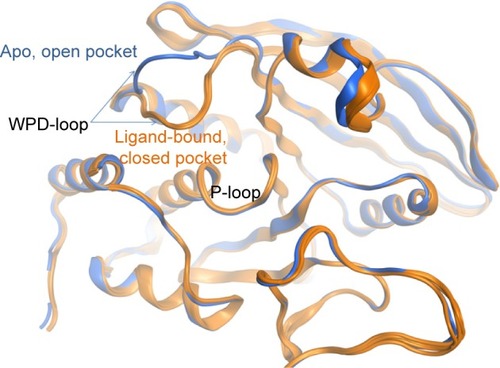
Figure 7 Active site conformational effect on the PTP1B druggability.
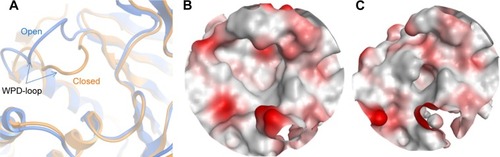
Table 3 Median values of Dscore and other SiteMap factors obtained by the open and closed structures of PTP1B
Figure 8 Examples of potent PTP inhibitors belonging to different druggability class along with their experimental potency and calculated TPSA (produced by MOECitation16).
Abbreviations: TPSA, total polar surface area; PTP, protein tyrosine phosphatase.
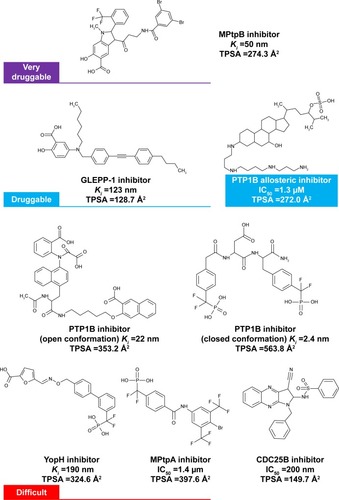
Table 4 Comparison of the median values of the SiteMap druggability factors obtained by solvated and unsolvated pockets of a total number of 43 PTP1B structures
Figure 9 The location of catalytic and allosteric pockets on the PTP1B structure along with their co-crystallized ligands.
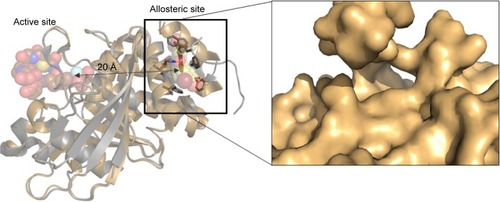
Table 5 Comparison of druggability data obtained by the catalytic pocket allosteric pockets of PTP1B