Figures & data
Figure 1 Distribution of patients who were evaluated.
Abbreviations: LBP, low back pain; AS, ankylosing spondylitis; USpA, undifferentiated spondyloarthropathy; PsA, psoriatic arthritis; ReA, reactive arthritis; EnA, enteropathic arthritis.
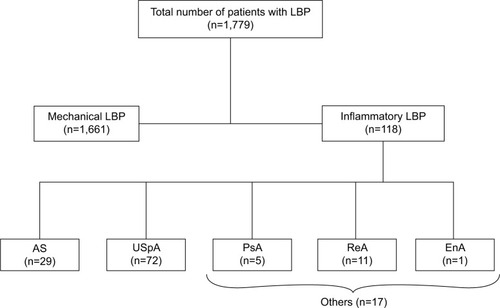
Table 1 Mean and SE of age and disease duration in patients with back pain
Table 2 Response rate to sulfasalazine in patients with back pain according to sex and underlying disease
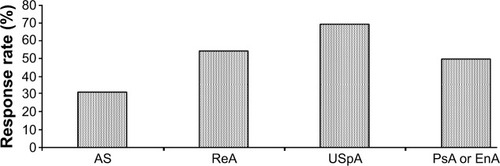
Figure 2 Response rate (%) to sulfasalazine with respect to underlying diseases in low back pain patients.
Abbreviations: AS, ankylosing spondylitis; ReA, reactive arthritis; USpA, undifferentiated spondyloarthropathy; PsA, psoriatic arthritis; EnA, enteropathic arthritis.