Figures & data
Figure 1 The identification of the triazole compound that activated autophagy.
Notes: (A) Plasmid construction of ΔC-TBP/Q36 and Q79. The ΔC-TBP constructs with enclosure of 36 and 79 glutamine repeats, respectively, by conjugating with EGFP at 3′-end were established. The numbers underneath represent the length of amino acids in each domain. (B) The chemical structure of OC-13. The synthetic triazole compound, 5,5′-(4,4′-(1,3-phenylene-bis(oxy))-bis(methylene)-bis(1H-1,2,3-triazole-4,1-diyl))-bis(methylene)-bis(3-(naphthalene-1-yl)oxazolidin-2-one), has molecular weight 722.2. (C) Flow cytometric analysis. The top panel shows Lysotracker fluorescence determination by flow cytometric analysis following treatment with 20 µM of OC-13 for 0, 12, 24, and 48 h in the induced Q36 (top left) and Q79 (top right) clones, respectively. The bottom panel indicates flow cytometric analysis of the induced Q36 (bottom left) and Q79 (bottom right) clones after 48 h treatment with 5, 10, and 20 µM and DMSO control. (D) LysoTracker fluorescence enhancement by the increased OC-13 concentrations. Quantitative determination of LysoTracker fluorescence intensities was plotted in Q36 and Q79 clones after 48 h treatment with 5, 10, and 20 µM. The relative fluorescent levels were obtained by comparing that of DMSO treatment (*P<0.05, **P<0.01, Student’s t-test, compared with vehicle control DMSO). (E) Temporal increases of LysoTracker fluorescence. Quantitative determination of LysoTracker fluorescence intensities in the induced Q36 and Q79 clones following treatment with 20 µM OC-13 for 12, 24, and 48 h, respectively. The relative fluorescent levels were obtained by comparing with that at 0 h treatment (*P<0.05, **P<0.01, Student’s t-test, compared with 0 h). (F) Viable cell number determination. Both Q36 and Q79 clones were cultured onto cell plates (2×10⁴ cells per well) in Dulbecco’s Modified Eagle’s Medium supplemented with 10% fetal bovine serum. The cells were induced with doxycycline for 4 days followed by treating with 5, 10, and 20 µM and DMSO control for 48 h, respectively. Cells were trypsinized and collected. The numbers of viable cells were counted using trypan blue exclusion assay and calculated. Columns stand for mean values of cell numbers of three independent and experiments; bars are standard errors (**P<0.01, Student’s t-test, compared with vehicle control DMSO).
Abbreviations: ΔC-TBP, C-terminus-truncated TBP; DMSO, dimethyl sulfoxide; EGFP, enhanced green fluorescence protein; h, hours.
Abbreviations: ΔC-TBP, C-terminus-truncated TBP; DMSO, dimethyl sulfoxide; EGFP, enhanced green fluorescence protein; h, hours.
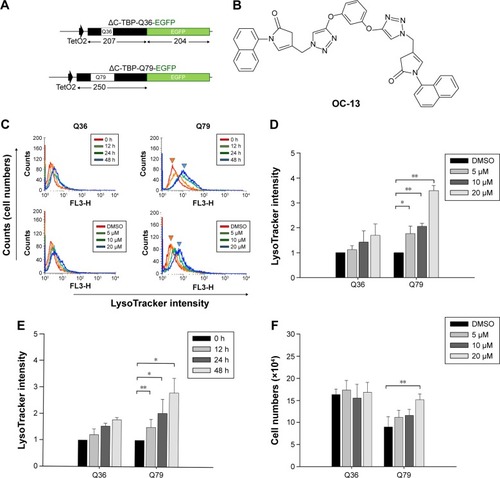
Figure 2 OC-13 activated autophagic flux and dissolved the insoluble Q79-EGFP aggregates.
Notes: (A) Western blot analysis. Protein lysates of the induced clones Q36 and Q79 by treating with 5, 10, and 20 µM of OC-13 for 48 h were subjected to Western blot analysis. The blots were analyzed for expressions of EGFP, p62, Beclin-1, Bcl-2, and LC3 with GAPDH as loading control. The numbers underneath signify relative intensities compared with that of DMSO vehicle control treatment. The result is a representation of three individual experiments. (B) Filter trap assay. Cells were treated with OC-13 for 48 h. The insoluble pellets were collected and lysed in sodium dodecyl sulfate buffer. A total of 30 µg lysates were filtered through an acetate membrane that was probed with EGFP antibodies to detect the trapped insoluble aggregates. The bottom represents values of densitometric values relative to DMSO control. (C) Densitometric determination of high molecular weight EGFP intensities. The induced Q36 and Q79 clones were treated with 5, 10, and 20 µM and DMSO control for 48 h. The densitometric analysis of the insoluble high molecular weight EGFP at each concentration was determined by first normalizing intensities at each concentration to that of the loading control and compared to those treated with DMSO. The error bars stand for standard error from three different experiments (**P<0.01, unpaired Student’s t-test as compared with vehicle control DMSO). (D) Densitometric determination of low molecular weight EGFP intensities. The induced Q36 and Q79 clones were treated with 5, 10, and 20 µM and DMSO control for 48 h. The densitometric values of soluble low molecular weight EGFP at each concentration were determined as in (C) and converted (*P<0.01 and **P<0.01, unpaired Student’s t-test as compared with vehicle control DMSO).
Abbreviations: D, DMSO; DMSO, dimethyl sulfoxide; EGFP, enhanced green fluorescence protein; GAPDH, glyceraldehyde 3-phosphate dehydrogenase; h, hours.
Abbreviations: D, DMSO; DMSO, dimethyl sulfoxide; EGFP, enhanced green fluorescence protein; GAPDH, glyceraldehyde 3-phosphate dehydrogenase; h, hours.
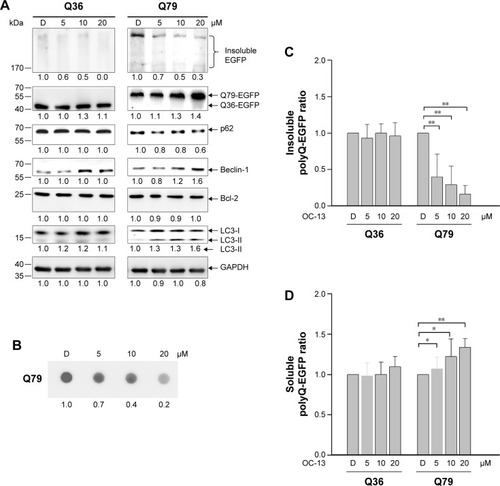
Figure 3 Nucleus exclusion and autophagic amelioration of Q79-EGFP aggregates.
Notes: (A) Confocal microscopy. The induced cells were treated with various concentrations of OC-13 for 48 h, fixed, incubated with LC3 (red) and EGFP (green) antibodies and counterstained with DAPI (blue). The slides were analyzed by confocal microscopy. The square areas as specified in each image were amplified as zoom-in picture to the right. Symbol arrow represents coalesced EGFP (green) and LC3 (red) antibody-stained markers (scale bar =10 µm). (B) Fluorescence microscopy. The induced Q79 cells treated with 5, 10, and 20 µM of OC-13 as well as DMSO control for 48 h were analyzed using fluorescence microscopy. Cells with aggregates are indicated as spots (arrow) (scale bar =20 µm). (C) Quantitative determination of aggregates of various OC-13 concentrations. The aggregates were determined in the induced Q79 cells that were treated with various concentrations of OC-13. The spots numbers were counted in the 500 fluorescent EGFP+ cells at each concentration and plotted (**P<0.01, unpaired Student’s t-test, compared with cells of vehicle control DMSO).
Abbreviations: D, DMSO; DAPI, 4′,6-diamidino-2-phenylindole; DMSO, dimethyl sulfoxide; EGFP, enhanced green fluorescence protein; h, hours.
Abbreviations: D, DMSO; DAPI, 4′,6-diamidino-2-phenylindole; DMSO, dimethyl sulfoxide; EGFP, enhanced green fluorescence protein; h, hours.
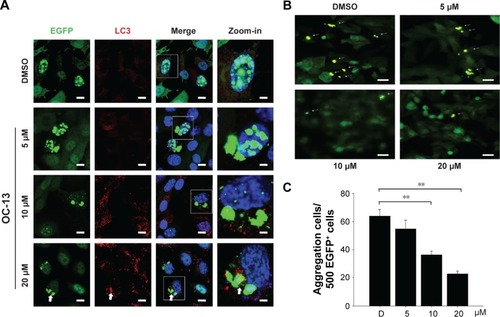
Figure 4 The autophagy pathway is related to JNK signaling activation.
Notes: (A) Western blot analysis. The collected protein lysates of the induced Q79 clone treated with 5, 10, and 20 µM of OC-13 plus DMSO control for 48 h were subjected to Western blot analysis and the membrane incubated with Akt, pAkt, S6K, pS6K, JNK1/2, p-JNK1/2, Beclin-1, and GAPDH antibody, respectively. The bottom numbers represent densitometric determination of ratios of phosphorylated and total proteins relative to DMSO control. The result is a representation of three individual experiments. (B) Incomplete clearance with inhibited autophagy. The induced Q79 clones pretreated with 1 nM autophagy inhibitor Baf A1 (+) or without (−) for 1 h were incubated with various concentrations of OC-13 for 48 h. The cell lysate proteins as separated by sodium dodecyl sulfate polyacrylamide gel electrophoresis gels were analyzed by immunoblotting with antibodies against p62, LC3, and GAPDH. Densitometry analysis of p62 levels was calculated relative to vehicle DMSO. The relative intensities of LC3-II were converted into ratios and compared with that of DMSO control. (C) Statistical analysis of LC3-II intensity. Densitometry analysis of LC3-II intensity ratio in cells with pretreatment of 1 nM autophagy inhibitor Baf A1 (+) or without (−) for 1 h before being incubated with various concentrations of OC-13 for 48 h. The relative intensities of LC3-II were calculated relative to that of vehicle control DMSO alone (−). The statistics were obtained from three individual experiments (*P<0.05, **P<0.01, Student’s t-test, compared with vehicle control DMSO).
Abbreviations: Baf A1, bafilomycin A1; D, DMSO; DMSO, dimethyl sulfoxide; GAPDH, glyceraldehyde 3-phosphate dehydrogenase; JNK1/2, c-Jun N-terminal protein kinase 1 and 2; h, hour.
Abbreviations: Baf A1, bafilomycin A1; D, DMSO; DMSO, dimethyl sulfoxide; GAPDH, glyceraldehyde 3-phosphate dehydrogenase; JNK1/2, c-Jun N-terminal protein kinase 1 and 2; h, hour.
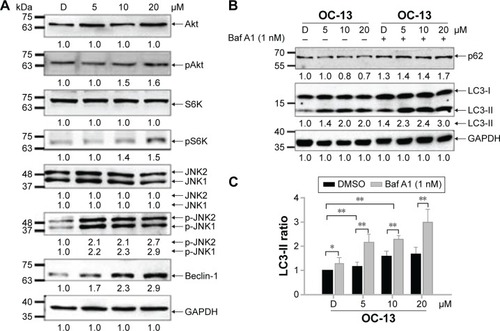
Figure 5 Inhibition autophagy flux blocked clearance of the Q79-EGFP aggregates.
Notes: (A) Aggregation cell number determination by fluorescence microscopy. The induced Q79 cells were incubated with 200 nM insulin, 20 µM 3-MA, 1 nM Baf A1, and 10 µM JNK inhibitor Sp600125, respectively, for 1 h before being treated with vehicle control DMSO (top panel) and 20 µM of OC-13 (bottom panel) for 12 h. The aggregate spots of fluorescence microscopy were pointed out (arrow) (scale bar =20 µm). (B) Quantitative determination of aggregate numbers. By counting the aggregate numbers in fluorescent cells, the aggregates in the induced Q79 clone with pretreatment of various inhibitors as specified before being treated with OC-13 (20 µM) or DMSO for 12 h. The total aggregates as counted in 500 EGFP+ cells of OC-13 treatment were compared with those of DMSO control (**P<0.01, *P<0.05, Student’s t-test). (C) Western blot analysis of the insoluble proteins. The induced Q79 cells were incubated with 200 nM insulin, 20 µM 3-MA, 1 nM Baf A1, and 10 µM Sp600125, respectively, for 1 h before being treated with 20 µM of OC-13 or DMSO for 48 h. The cell lysate proteins as separated by sodium dodecyl sulfate polyacrylamide gel electrophoresis gels were analyzed by immunoblotting for expressions of EGFP with GAPDH as loading control. The numbers underneath signify relative intensities by comparing with that of DMSO treatment. (D) Densitometric determination of high molecular weight EGFP levels. The densitometric values of the insoluble high molecular weight EGFP at each concentration were determined by first normalizing to the loading control and compared with those treated with DMSO without inhibitor pretreatment. The error bars stand for SE from three different experiments (**P<0.01, unpaired Student’s t-test as compared with vehicle control DMSO).
Abbreviations: Baf A1, bafilomycin A1; D, DMSO; DMSO, dimethyl sulfoxide; EGFP, enhanced green fluorescence protein; GAPDH, glyceraldehyde 3-phosphate dehydrogenase; JNK, c-Jun N-terminal protein kinase; 3-MA, 3-methyladenine; h, hour; W/O, without.
Abbreviations: Baf A1, bafilomycin A1; D, DMSO; DMSO, dimethyl sulfoxide; EGFP, enhanced green fluorescence protein; GAPDH, glyceraldehyde 3-phosphate dehydrogenase; JNK, c-Jun N-terminal protein kinase; 3-MA, 3-methyladenine; h, hour; W/O, without.
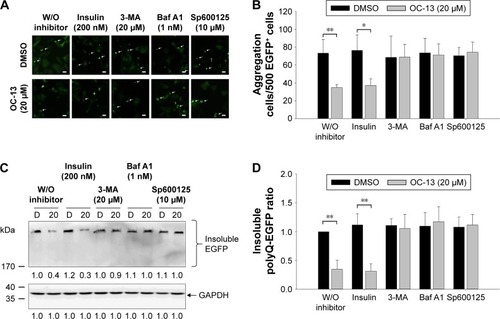
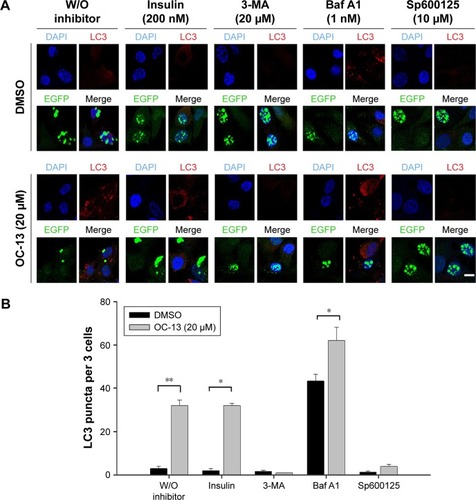
Figure 6 Inhibition lysosome fusion with autophagosome impaired clearance of the Q79-EGFP aggregates.
Notes: (A) Puncta determination by confocal microscopy. The induced Q79 cells were incubated with 200 nM insulin, 20 µM 3-MA, 1 nM Baf A1, and 10 µM Sp600125, respectively, for 1 h before being treated with DMSO as vehicle control (top panel) or 20 µM of OC-13 (bottom panel) for 12 h. The cells were fixed, incubated with LC3 (red) and EGFP (green) antibodies and counterstained with DAPI (blue). The slides were analyzed by confocal microscopy (scale bar =10 µm, and applied to all images). (B) Quantitative determination of LC3 puncta per three cells. To determine puncta in three cells, the numbers in the induced Q79 clone with pretreatment of various inhibitors were counted as specified before treatment with OC-13 (20 µM) or DMSO for 12 h. The total puncta in three cells by OC-13 treatment were compared with DMSO (**P<0.01, *P<0.05, Student’s t-test).
Abbreviations: Baf A1, bafilomycin A1; DAPI, 4′,6-diamidino-2-phenylindole; DMSO, dimethyl sulfoxide; EGFP, enhanced green fluorescence protein; 3-MA, 3-methyladenine; h, hour; W/O, without.
Abbreviations: Baf A1, bafilomycin A1; DAPI, 4′,6-diamidino-2-phenylindole; DMSO, dimethyl sulfoxide; EGFP, enhanced green fluorescence protein; 3-MA, 3-methyladenine; h, hour; W/O, without.