Figures & data
Figure 1 (A) Chemical structures of isolated compounds 5-hydroxy-7,4′-dimethoxy-6,8-di-C-methylflavone (1), kaempferol-3-O-β-d-glucopyranoside (2), and kaempferol-3-O-α-l-rhamnopyranoside (3) and (B) cytotoxicities of compounds 1, 2, and 3 in human gastric cancer cells (AGS).
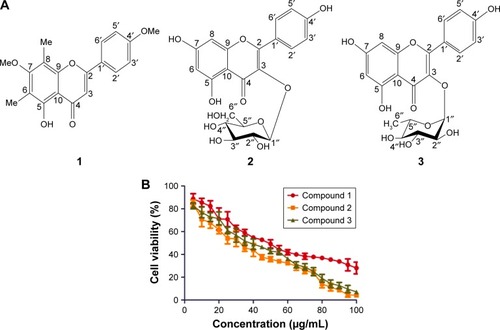
Figure 2 Induction of AGS cell death by compounds 1, 2, and 3 after 48 h of incubation with different concentrations (25, 50, 75, and 100 μg/mL) at 37°C in an atmosphere of 5% CO2.
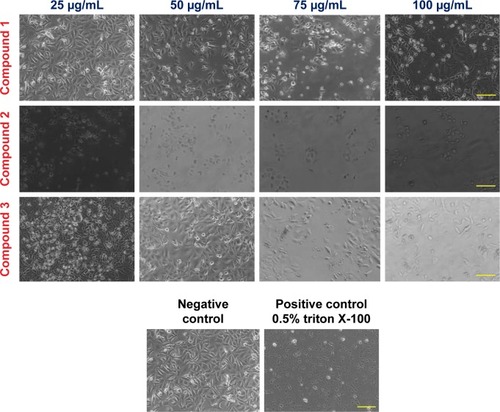
Figure 3 (A) Cell cycle analysis of AGS cells, treated with compounds 1, 2, and 3 at different concentrations (0, 25, 50, and 75 μg/mL, respectively) and incubated for 48 h at 37°C in an atmosphere of 5% CO2
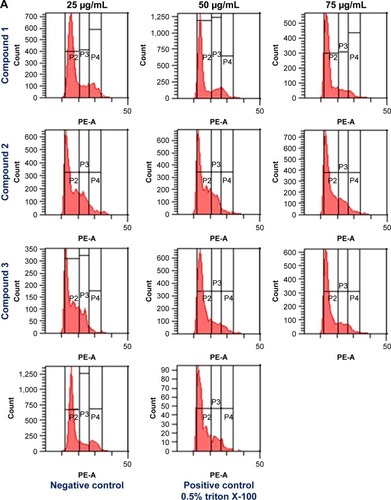
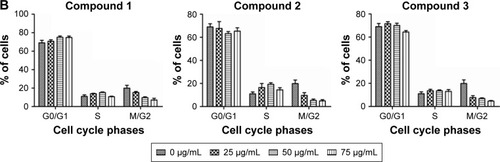
Table 1 Bonding characterization and binding energies in kcal/mol with various molecular therapeutic targets involved in gastric cancer
Figure 4 (A) Structural alignment of compounds 1–3 depicted with pharmacophore features; (B) three-dimensional pharmacophore features generated from complex of human growth factor receptor-2-compound 2; and (C) the retrieved best 10 hits and their RMSDs with compound 2.
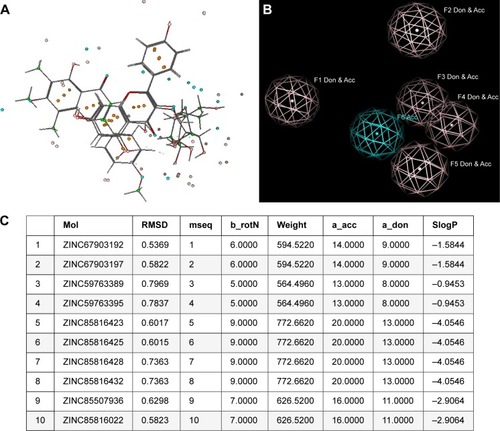
Table 2 Lipinski’s parameter, drug score, drug likeness, and adverse effects of isolated compounds 1–3 and the best hits computed with MOLINSPERATION and OSIRIS server
Table 3 Bonding characterization of similar pharmacophore hits for compound 2 from ZINC database against HER2
Figure 5 Backbone root mean square deviation values (A), root mean square fluctuations of backbone atoms (C), radius of gyration of backbone atoms (D), solvent accessible surface area (E) of HER2a, HER2b, HER2c, HER2d, and HER2e, and backbone RMSD and SASA values (B and F) for compounds 1, 2, 3, and ZINC67903192 during 20 ns molecular dynamic simulations.
Abbreviations: HER, human growth factor receptor; RMSD, root mean square deviation.
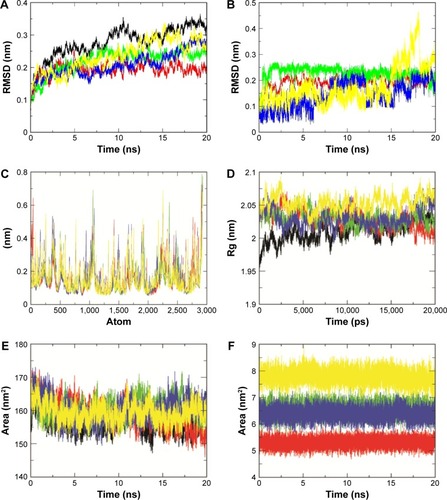
Figure 6 (A) Cα RMSF values of HER2, HER2-compound 1, HER2-compound 2, HER2-compound 3, and HER2-ZINC67903192 were plotted against residue numbers; (B) the profile of Cα atomic fluctuations of key H-bonding residues in the catalytic site of HER2.
Abbreviations: HER, human growth factor receptor; RMSF, root mean square fluctuation.
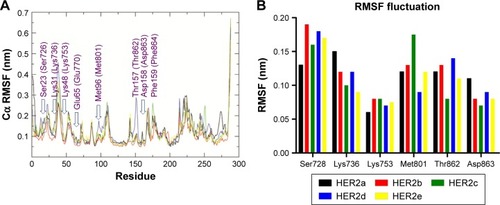
Figure 7 Secondary structural changes in HER2a, HER2b, HER2c, HER2d, and HER2e (A, B, C, D, and E, respectively) during 20 ns of molecular dynamic simulations, reported through Database of Secondary Structure of Proteins software.
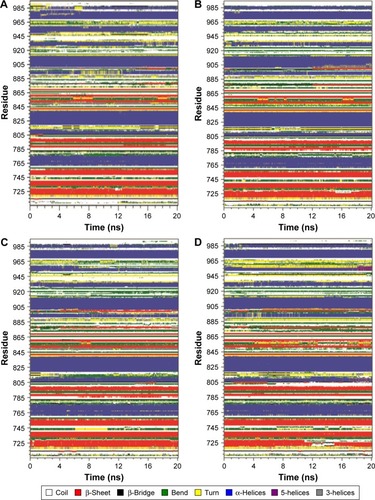
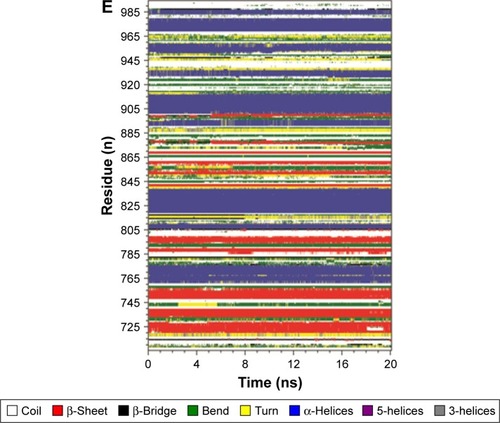
Figure 8 Molecular interactions of compounds 1, 2, 3 and structural hit ZINC67903192 with tyrosine kinase domain of human growth factor receptor-2 (A, B, C, and D, respectively).
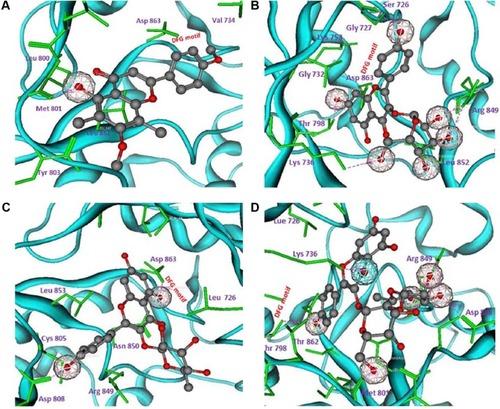
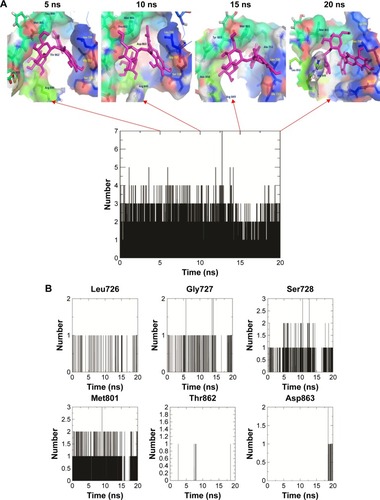
Figure 9 (A) The snapshots of docking pose of compound 2 and total H-bond intensity at various time scale intervals in 20 ns complex molecular dynamic simulations with human growth factor receptor-2; (B) hydrogen bond diagram between compound 2 and active site residues, namely, Leu726, Gly726, Ser728, Gly729, and Met801 of human growth factor receptor-2.
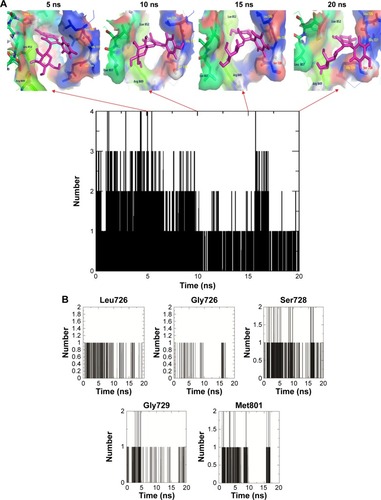
Figure 10 (A) The snapshots of docking pose of ZINC67903192 and total H-bond intensity at various time scale intervals in 20 ns complex molecular dynamic simulations with human growth factor receptor-2; (B) hydrogen bond diagram between ZINC67903192 and active site residues, namely, Leu726, Gly727, Ser728, Met801, Thr862, and Asp863 of human growth factor receptor-2.