Figures & data
Figure 1 Transmission electron microscope images of CM-HSANPs (A) and F-CM-HSANPs (B) (×20,000).
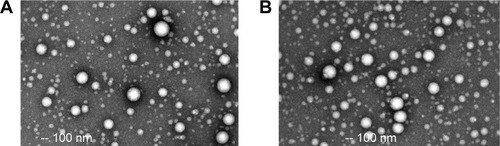
Table 1 Storage stability of F-CM-HSANPs at 25°C and 60% RH (n=3)
Figure 2 In vitro release of CM from free CM, CM-HSANPs, and F-CM-HSANPs (n=3).
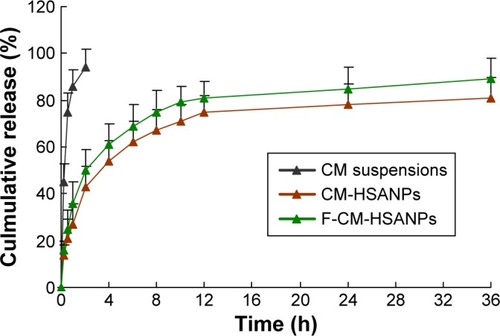
Table 2 Pharmacokinetic parameters of CM after IV administration of CM solution, CM-HSANPs, and F-CM-HSANPs to rats (n=6)
Figure 3 Plasma concentration–time profiles of CM solution, CM-HSANPs, and F-CM-HSANPs after IV administration to rats (n=6).
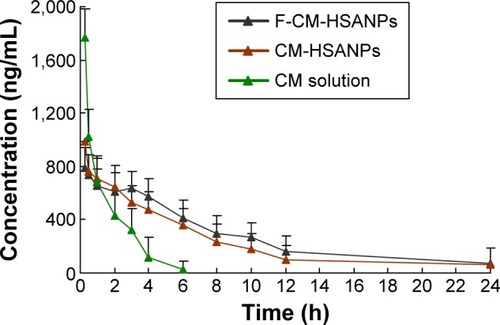
Figure 4 The diagram of human colon cancer (HT 29 cells) xenograft models in vivo.
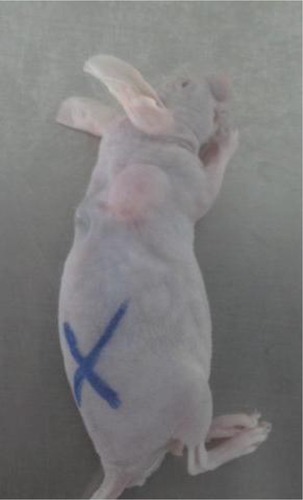
Figure 5 In vivo antitumor activities of free CM, CM-HSANPs, and F-CM-HSANPs (10 mg/kg) in human colon cancer (HT29 cells) xenograft models after the IV administration (n=8).
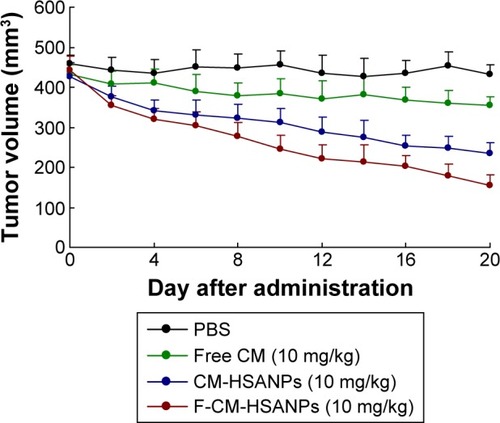
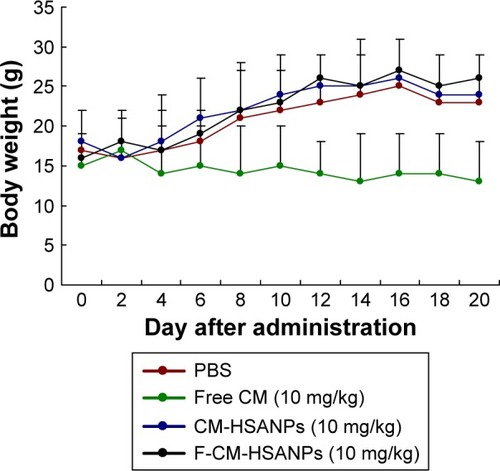
Figure 6 Body weight changes of free CM, CM-HSANPs, and F-CM-HSANPs (10 mg/kg) in human colon cancer (HT29 cells) xenograft models after the IV administration (n=8).