
Figures & data
Figure 1 Study design.
Abbreviation: h, hour.
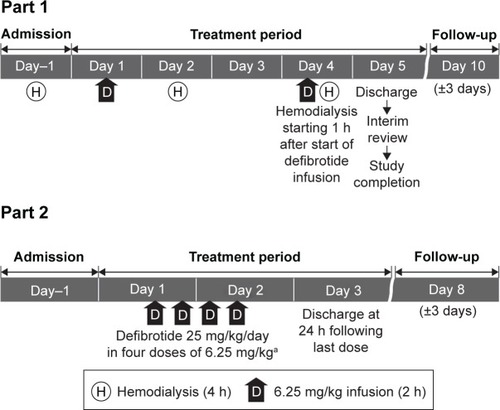
Table 1 Demographic and baseline characteristics
Table 2 Part 1: plasma defibrotide PK parameters in dialysis-dependent subjects with ESRD
Figure 2 Plasma concentrations (±SD) following a single dose of defibrotide: nondialysis day versus dialysis day. The 4-h hemodialysis session was begun 1 h after initiation of the defibrotide 2-h intravenous infusion.
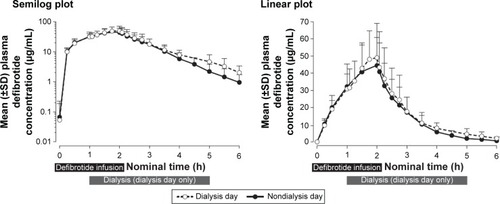
Table 3 Plasma defibrotide PK parameters in DD subjects (N=6, Part 1) and following single and multiple doses in renal-impaired (n=6) and healthy matching subjects (n=6, Part 2)
Figure 3 Plasma defibrotide concentrations (±SD) following the first and fourth (last) doses of defibrotide: semilog and linear scales.
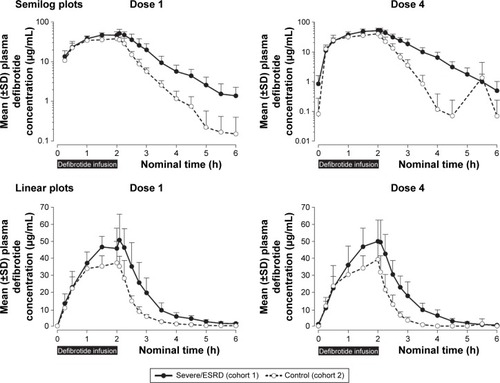
Table 4 Part 2 of the study: plasma defibrotide PK parameters following single and multiple doses in renal-impaired and healthy matching subjects
Table 5 Urinary defibrotide PK parameters following single and multiple doses in renal-impaired and healthy matching subjects